How I Monitor My Claude Code Usage with Grafana, OpenTelemetry, and VictoriaMetrics
I wanted better visibility into my Claude Code token usage, so I wired its OpenTelemetry output into my homelab monitoring stack. Here’s how I used Grafana, an OTel Collector, and VictoriaMetrics to track usage, cost, and other metrics over time.
As a DevOps engineer, Claude Code has been a fantastic addition to my tool belt. When I added the GSD plugin a month or two ago, it was another order of magnitude jump in what my AI tooling could do for me. It also resulted in my token usage going up rather… significantly. Simply put, GSD does a lot of additional work to defer context into a highly organized, well-structured system of markdown files.
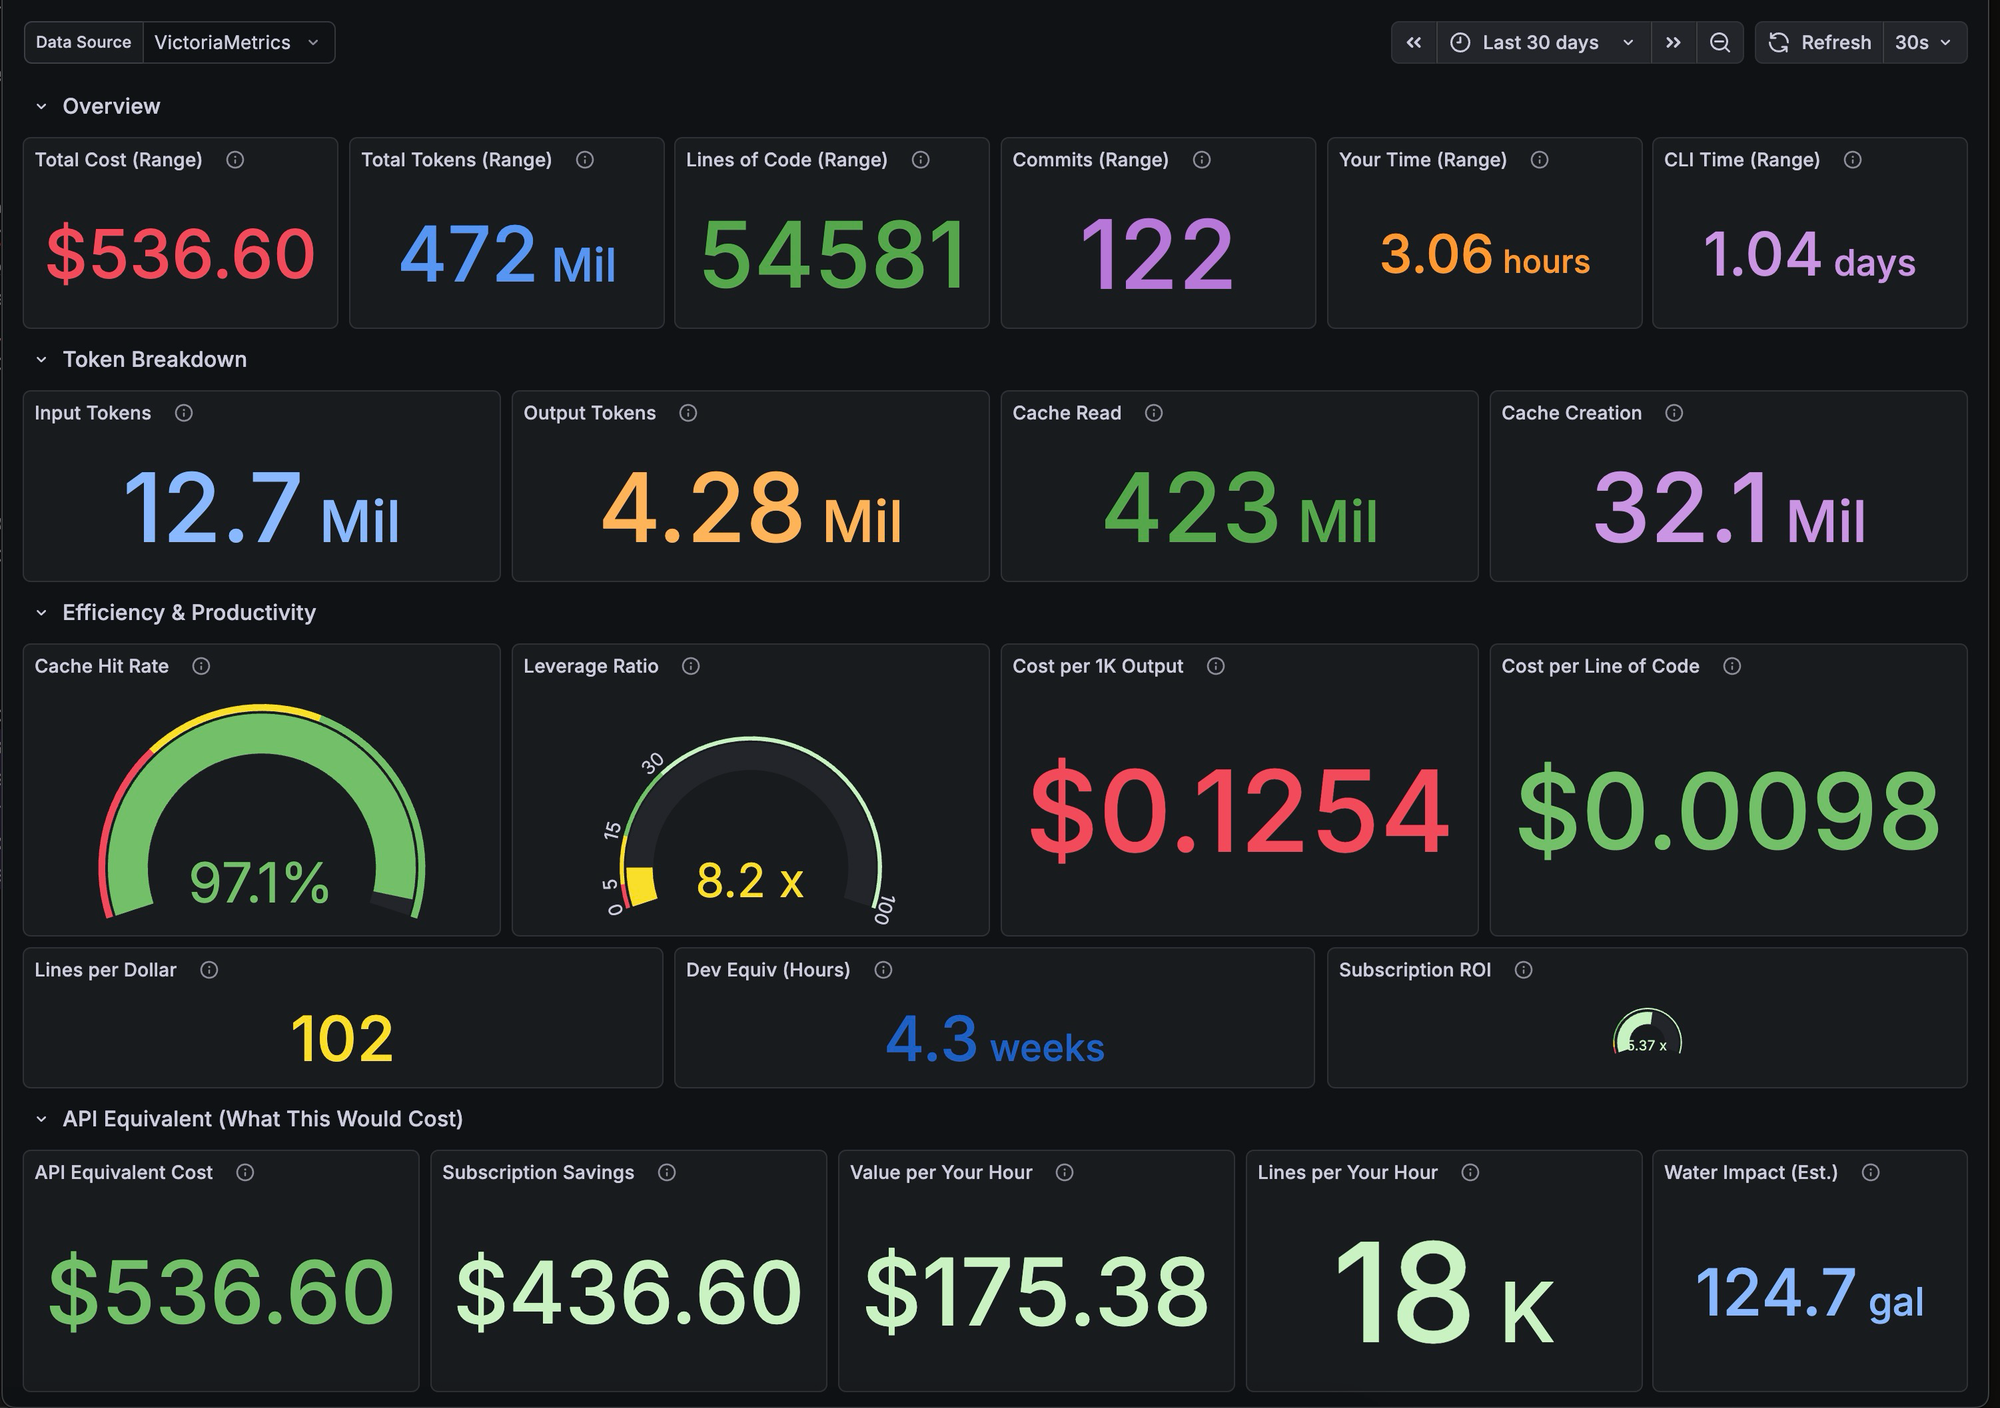
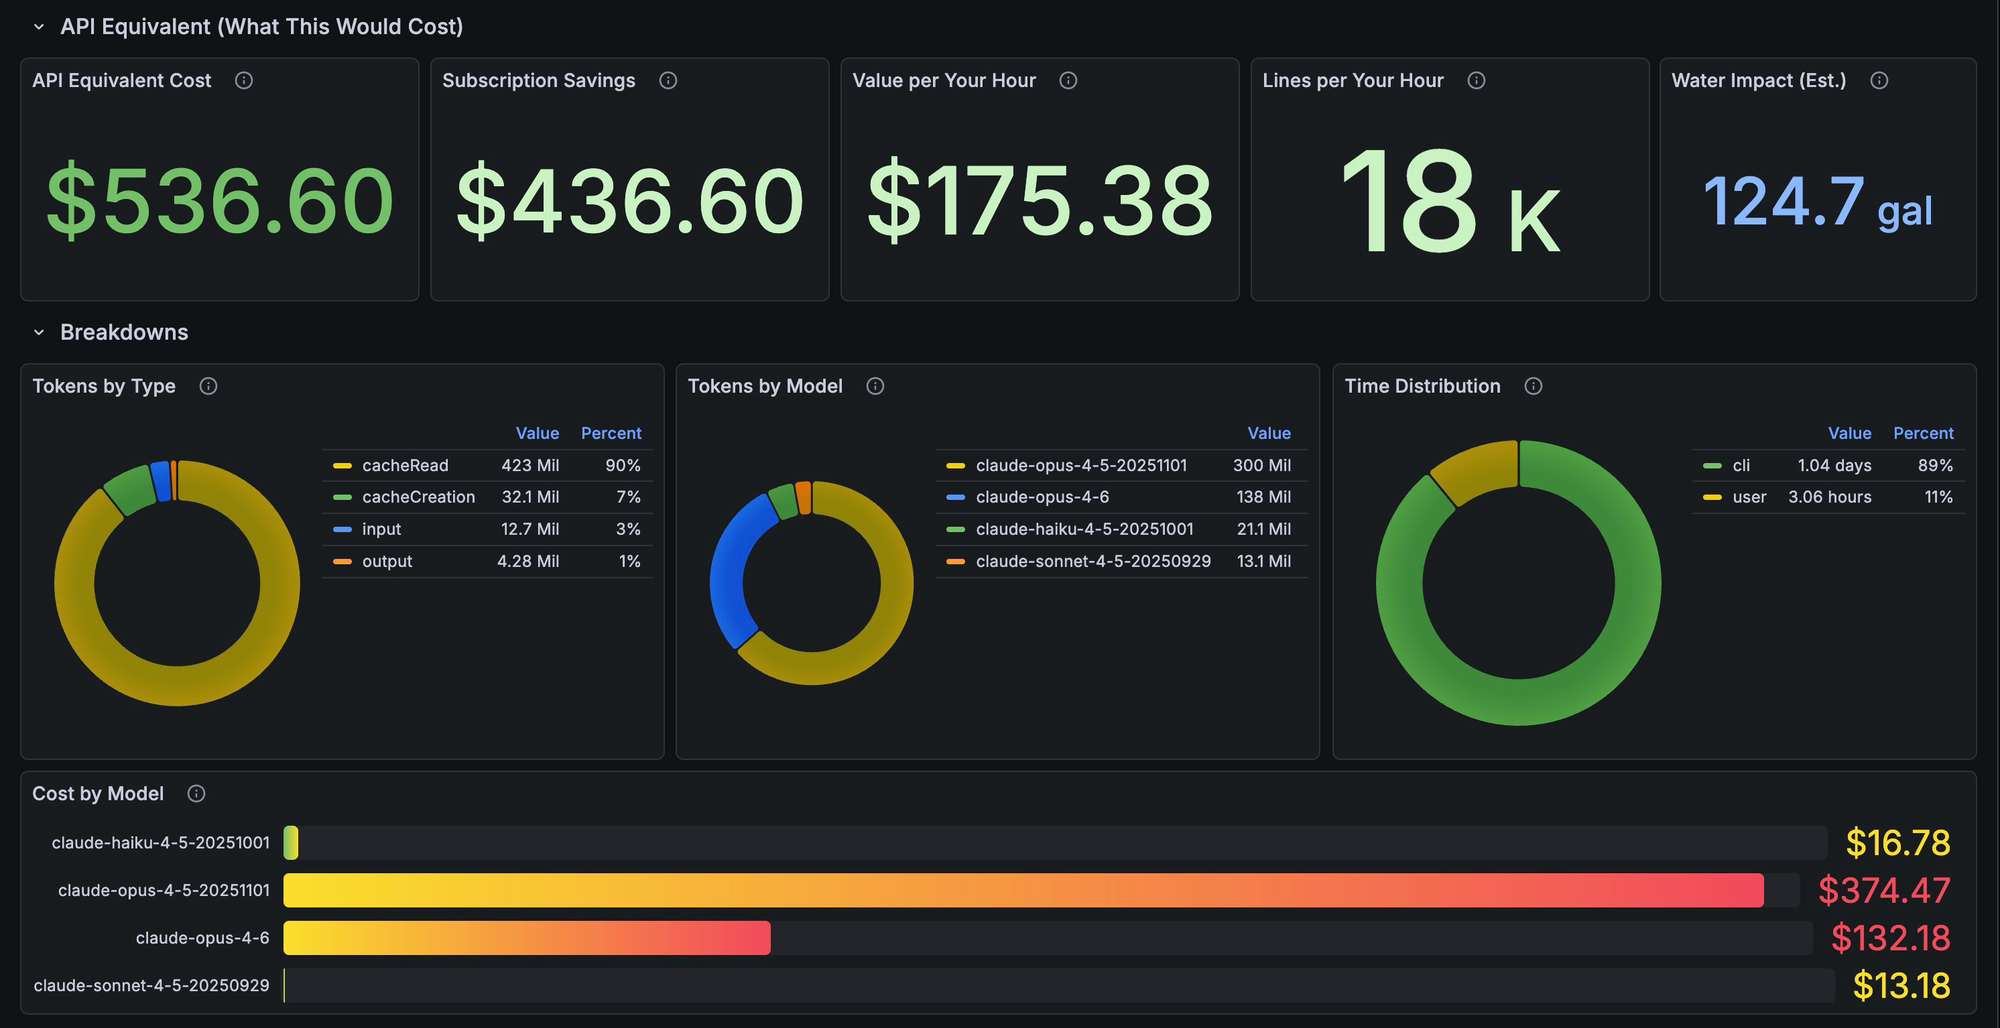
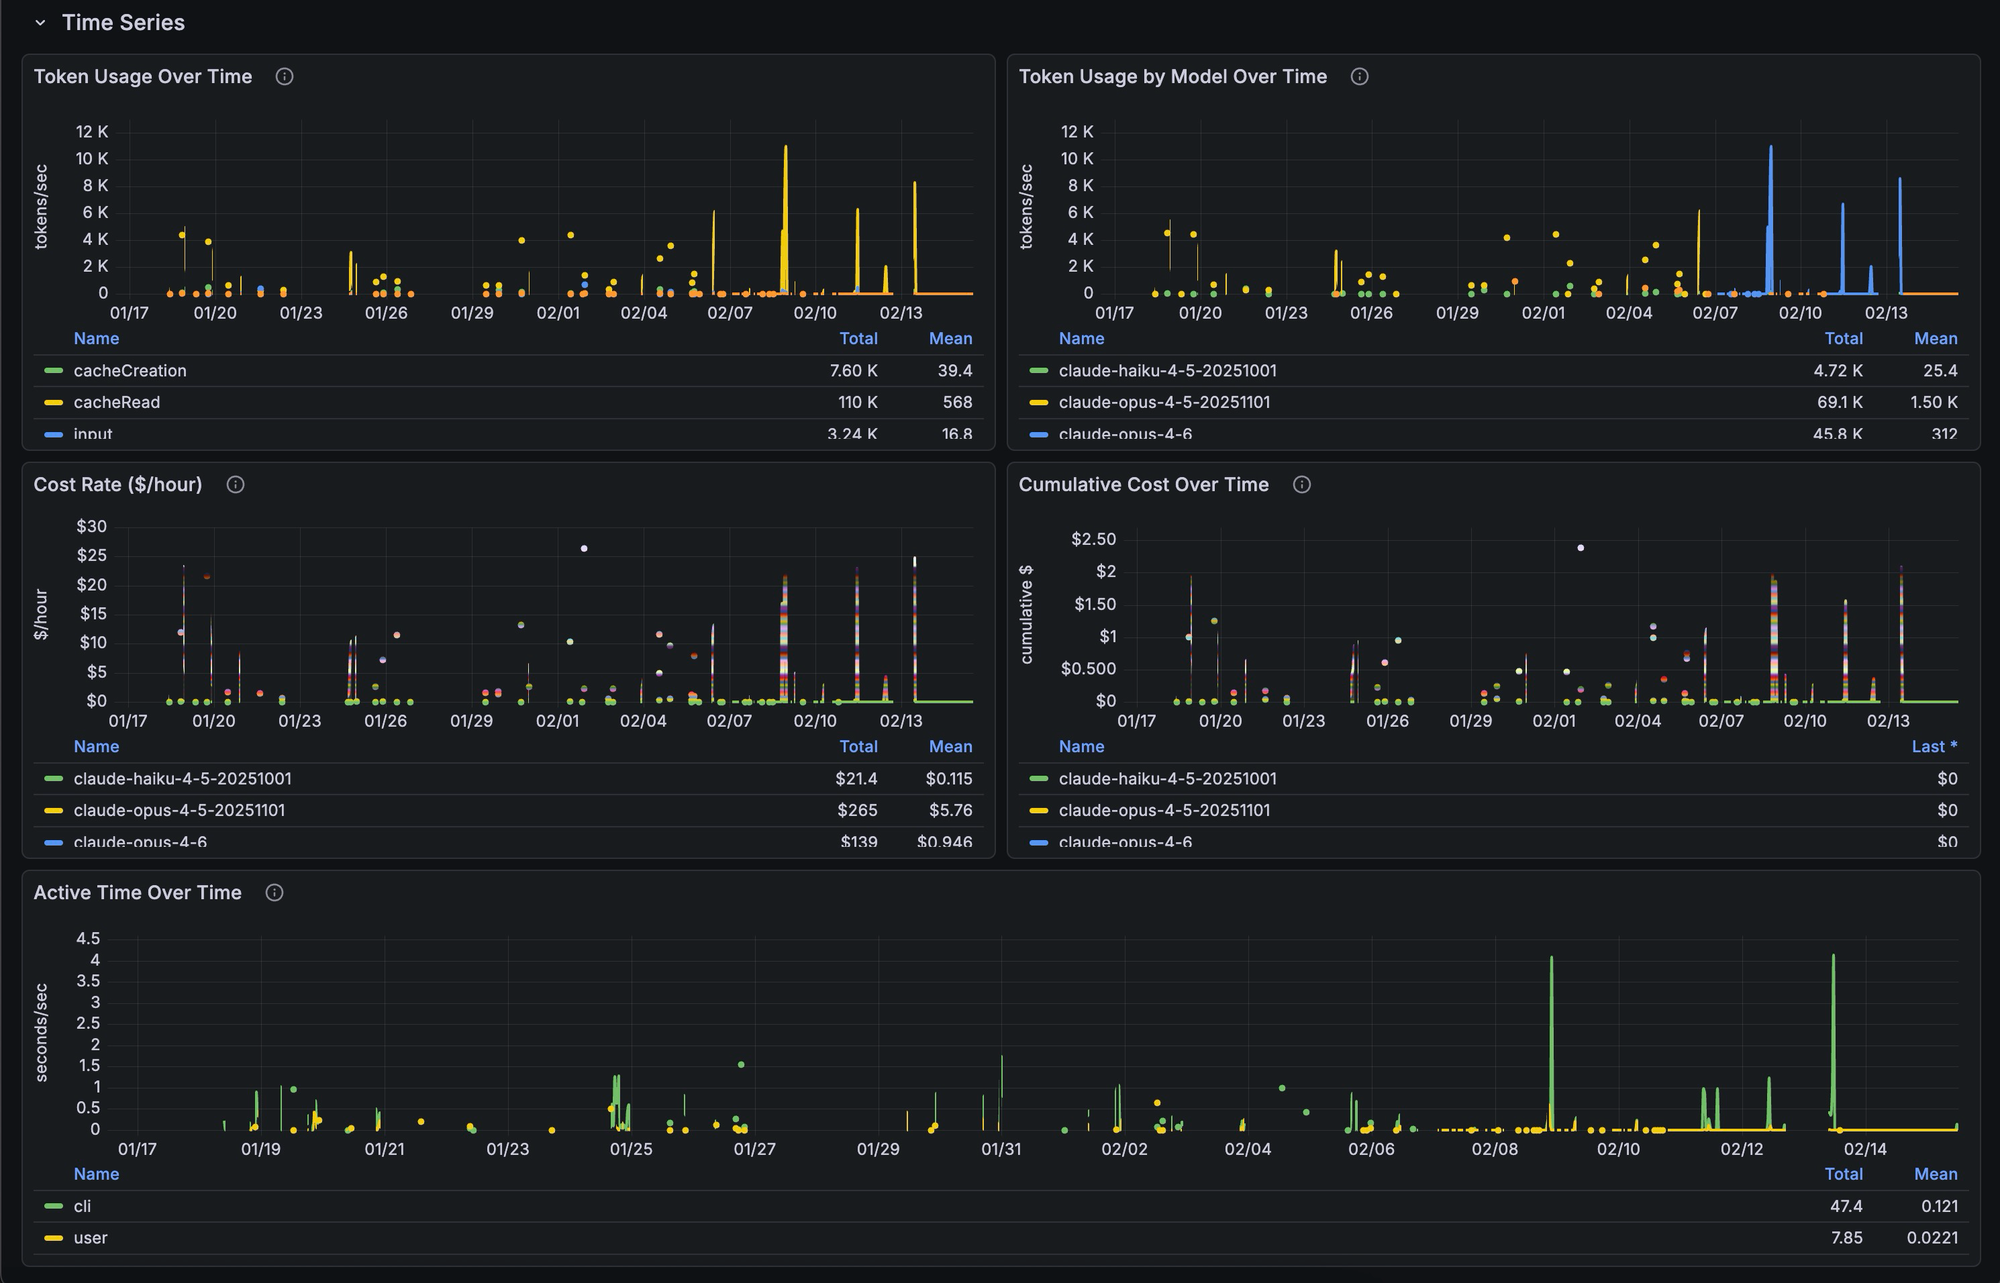
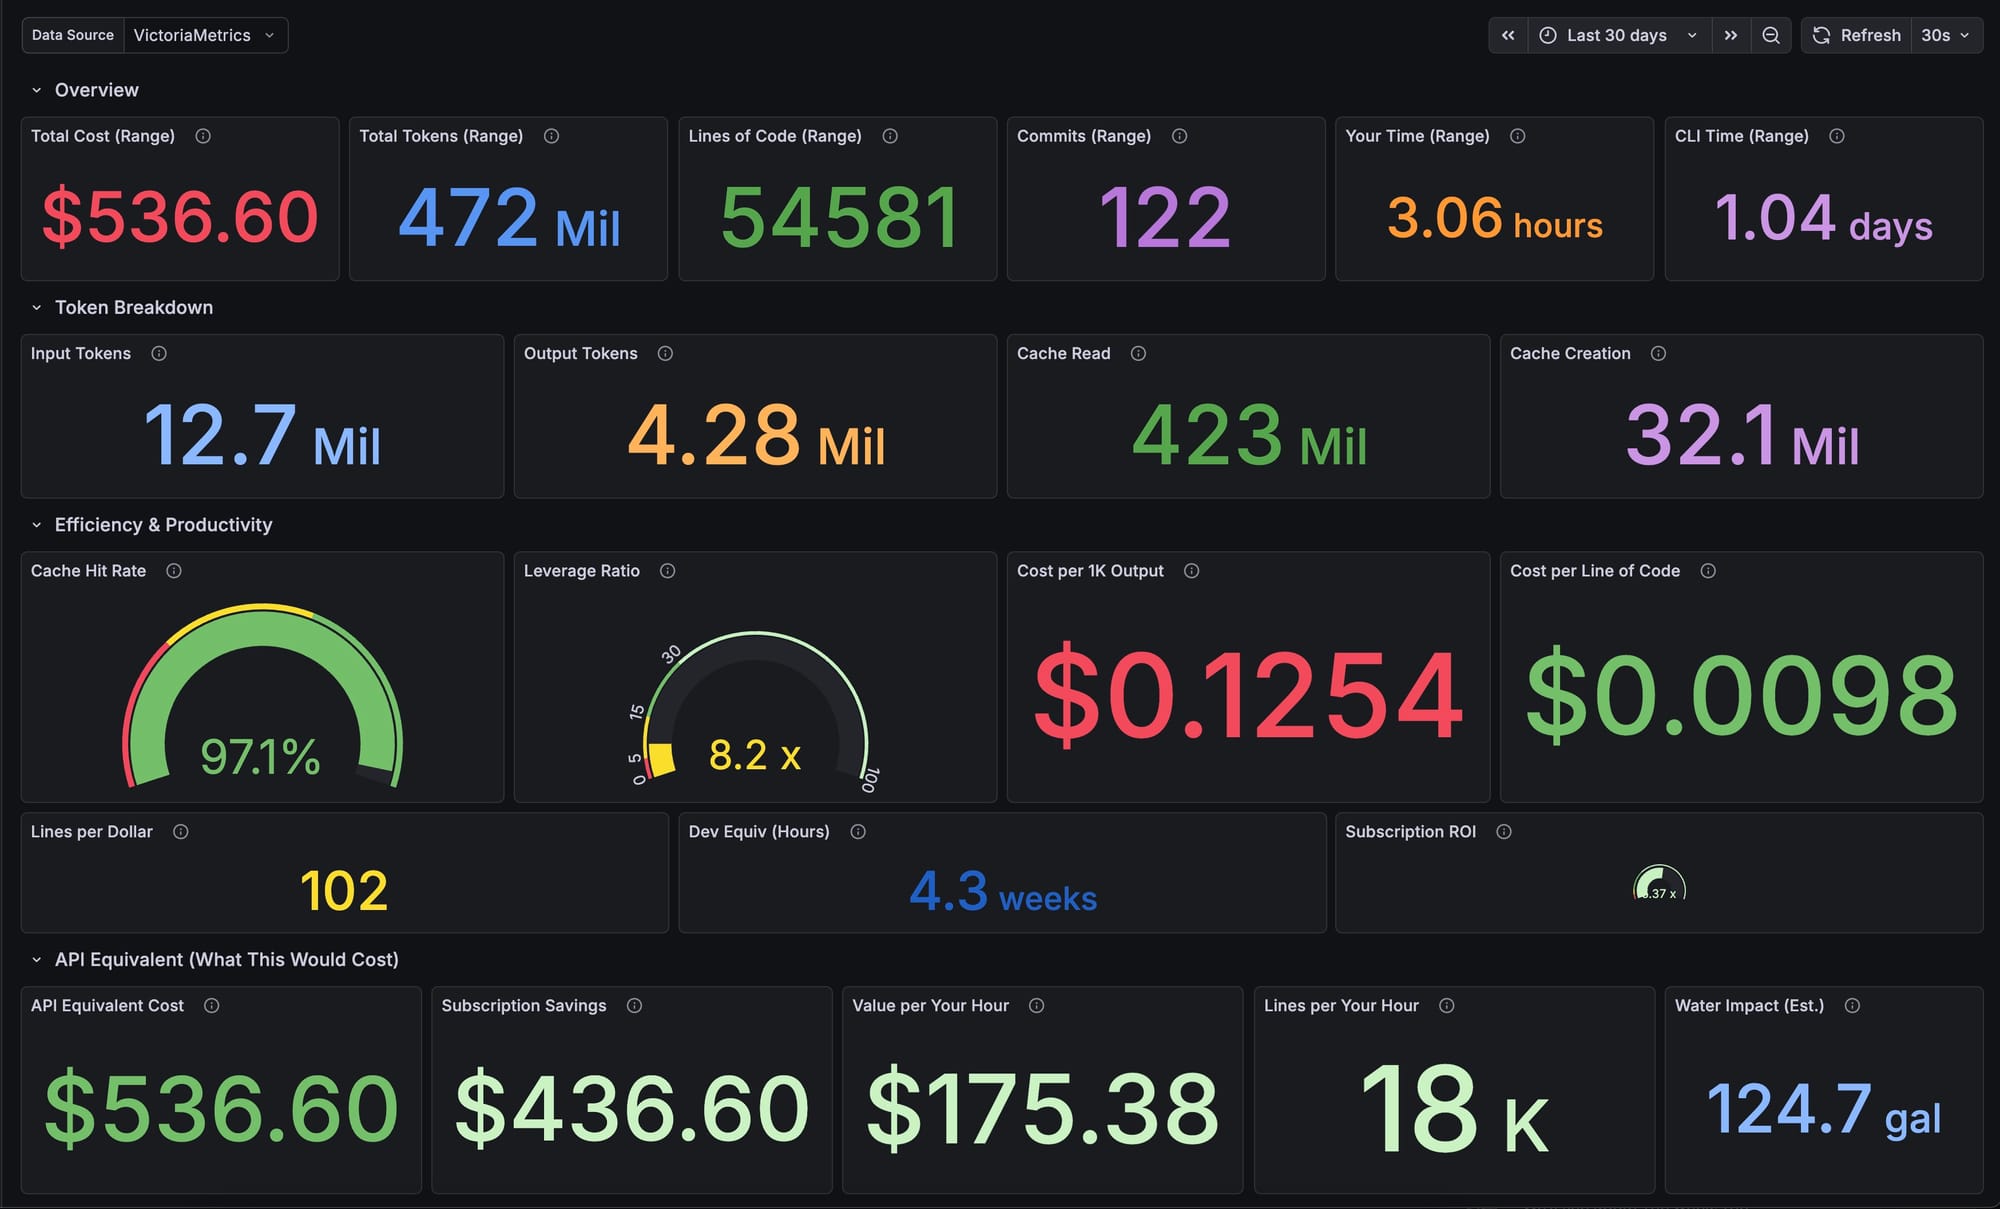
Claude Code already exposes token usage to the user, but I wanted more insight. Getting visibility beyond basic totals and into things like token usage per hour, cost per line of code, and even estimated water usage were all metrics I thought would be neat to see. Fortunately for me, Claude Code supports OpenTelemetry (OTel) out of the box.
To get started, I made use of my existing homelab monitoring stack, which consists of Grafana, Prometheus, an OTel Collector, and VictoriaMetrics. All of this lives in a K3s cluster in my lab environment.
The way the data flows is pretty straightforward. With Claude Code’s native OTel support, I just pointed my Mac at the OTel Collector endpoint by updating my ~/.claude/settings.json. Here’s what that looks like currently:
{
  "env": {
    "CLAUDE_CODE_ENABLE_TELEMETRY": "1",
    "OTEL_METRICS_EXPORTER": "otlp",
    "OTEL_LOGS_EXPORTER": "otlp",
    "OTEL_EXPORTER_OTLP_PROTOCOL": "grpc",
    "OTEL_EXPORTER_OTLP_ENDPOINT": "https://otel.k3s.tcudelocal.net:443",
    "OTEL_EXPORTER_OTLP_METRICS_TEMPORALITY_PREFERENCE": "cumulative",
    "OTEL_METRIC_EXPORT_INTERVAL": "10000",
    "OTEL_LOGS_EXPORT_INTERVAL": "5000"
  },
  "attribution": {
    "commit": "",
    "pr": ""
  },
  "hooks": {
    "SessionStart": [
      {
        "hooks": [
          {
            "type": "command",
            "command": "node \"$HOME/.claude/hooks/gsd-check-update.js\""
          }
        ]
      }
    ],
    "PostToolUse": [],
    "Stop": []
  },
  "statusLine": {
    "type": "command",
    "command": "node \"$HOME/.claude/hooks/gsd-statusline.js\""
  },
  "enabledPlugins": {
    "feature-dev@claude-code-plugins": true,
    "frontend-design@claude-code-plugins": true,
    "swift-lsp@claude-plugins-official": true
  },
  "skipDangerousModePermissionPrompt": true
}
Claude Code sends gRPC OTLP metrics, including token usage broken down by type (input, output, cache creation, cache reads), cost in USD, active session time, commit counts, and lines of code, to otel.k3s.tcudelocal.net. Traefik then handles routing that gRPC traffic to the OTel Collector. I chose to run the Collector as a single-replica Deployment rather than a DaemonSet since the only OTLP source in my case is my Mac. There was no reason for it to run on every node.
From there, the OTel Collector exports directly to VictoriaMetrics. In my initial iteration, I actually had it going exclusively to Prometheus. I’m a nerd, though, and I want to keep my metrics for at least a year. Prometheus does not handle long-term storage of this kind of data nearly as well as VictoriaMetrics and tends to get storage hungry quickly. VictoriaMetrics, on the other hand, has proven to be far more efficient in that regard.
It is worth mentioning that moving to VictoriaMetrics did result in some initial confusion on my end. I found that I needed to use the opentelemetry.usePrometheusNaming flag. Without it, VictoriaMetrics stores OTLP metrics using their original dot-notation names, like claude_code.token.usage. If your Grafana dashboards are written in PromQL, like mine, you will quickly discover that they expect Prometheus-style names, like claude_code_token_usage_tokens_total. Enabling that flag tells VictoriaMetrics to convert the naming scheme on ingestion so everything works properly with PromQL dashboards.
Another hang-up I ran into was that VictoriaMetrics silently drops metrics sent with delta temporality. If Claude Code’s OTel exporter is not configured for cumulative temporality, the data just disappears with no errors or warnings.
For the last part of the flow, Grafana ties everything together. It is configured with VictoriaMetrics as the default datasource, which gives dashboards access to the full timeline of data. The dashboards themselves live in a separate Git repository and are provisioned into Grafana automatically via a sidecar container that watches for ConfigMaps with the appropriate labels. ArgoCD keeps everything in sync. VictoriaMetrics deploys first, then the monitoring stack and OTel Collector come up, and finally the dashboards are provisioned on top.
The whole thing is GitOps from end to end. It has been massively overkill for a homelab setup, but also a LOT of fun.
If this setup interests you, you can find my current Grafana dashboard iteration here:
I am confident it could use some polishing and am open to feedback, but even in its current form, it has been pretty neat to look at.