Monitoring VMWare with InfluxDB and Grafana
Grafana dashboards offer a visually appealing and efficient way to track server metrics. In this guide, we’ll walk through the process of setting up Grafana with VMWare to monitor various metrics on your servers effectively.
Last year, I shared a guide on setting up Grafana for Proxmox. Having transitioned primarily to a VMWare stack, it’s the perfect time to explore a similar setup for VMWare.
Please Note: This guide assumes that you have vCenter operational, as it relies on its API.
At the end of this post, you’ll find links to some fantastic premade Grafana dashboards to kickstart your VMWare monitoring.
Creating Your Container Stack
I run my monitoring stack using Docker containers, orchestrated with Docker Compose. We'll set up three containers:
- Telegraf: Collects data from vCenter's API and sends it to InfluxDB.
- InfluxDB: The database that stores your metrics.
- Grafana: Visualizes metrics from InfluxDB.
Populate a docker-compose.yml file with the following contents:
version: "3"
services:
  grafana:
    image: grafana/grafana
    container_name: grafana_container
    restart: always
    ports:
      - 3000:3000
    networks:
      - monitoring_network
    volumes:
      - grafana-volume:/var/lib/grafana

  influxdb:
    image: influxdb
    container_name: influxdb_container
    restart: always
    ports:
      - 8086:8086
      - 8089:8089/udp
    networks:
      - monitoring_network
    volumes:
      - influxdb-volume:/var/lib/influxdb

  telegraf:
    image: telegraf
    container_name: telegraf_container
    restart: always
    networks:
      - monitoring_network
    volumes:
      - ./telegraf/telegraf.conf:/etc/telegraf/telegraf.conf:ro

networks:
  monitoring_network:
    external: true

volumes:
  grafana-volume:
    external: true
  influxdb-volume:
    external: true
Create the necessary Docker volumes and network by running:
docker volume create influxdb-volume
docker volume create grafana-volume
docker network create monitoring_network
I prefer separate volumes for InfluxDB and Grafana, primarily for the performance benefits.
Start the containers with docker compose up -d in the same directory as your docker-compose.yml file.
Addressing Startup Errors:
Upon starting the containers, you might encounter an error message about Telegraf's configuration. Here's how to fix it:
- Navigate to the telegraf directory.
- Remove the existing telegraf.conf file and create a new one:
rm -rf telegraf.conf
sudo touch telegraf.conf
Configuring InfluxDB
Start by visiting http://your_host:8086
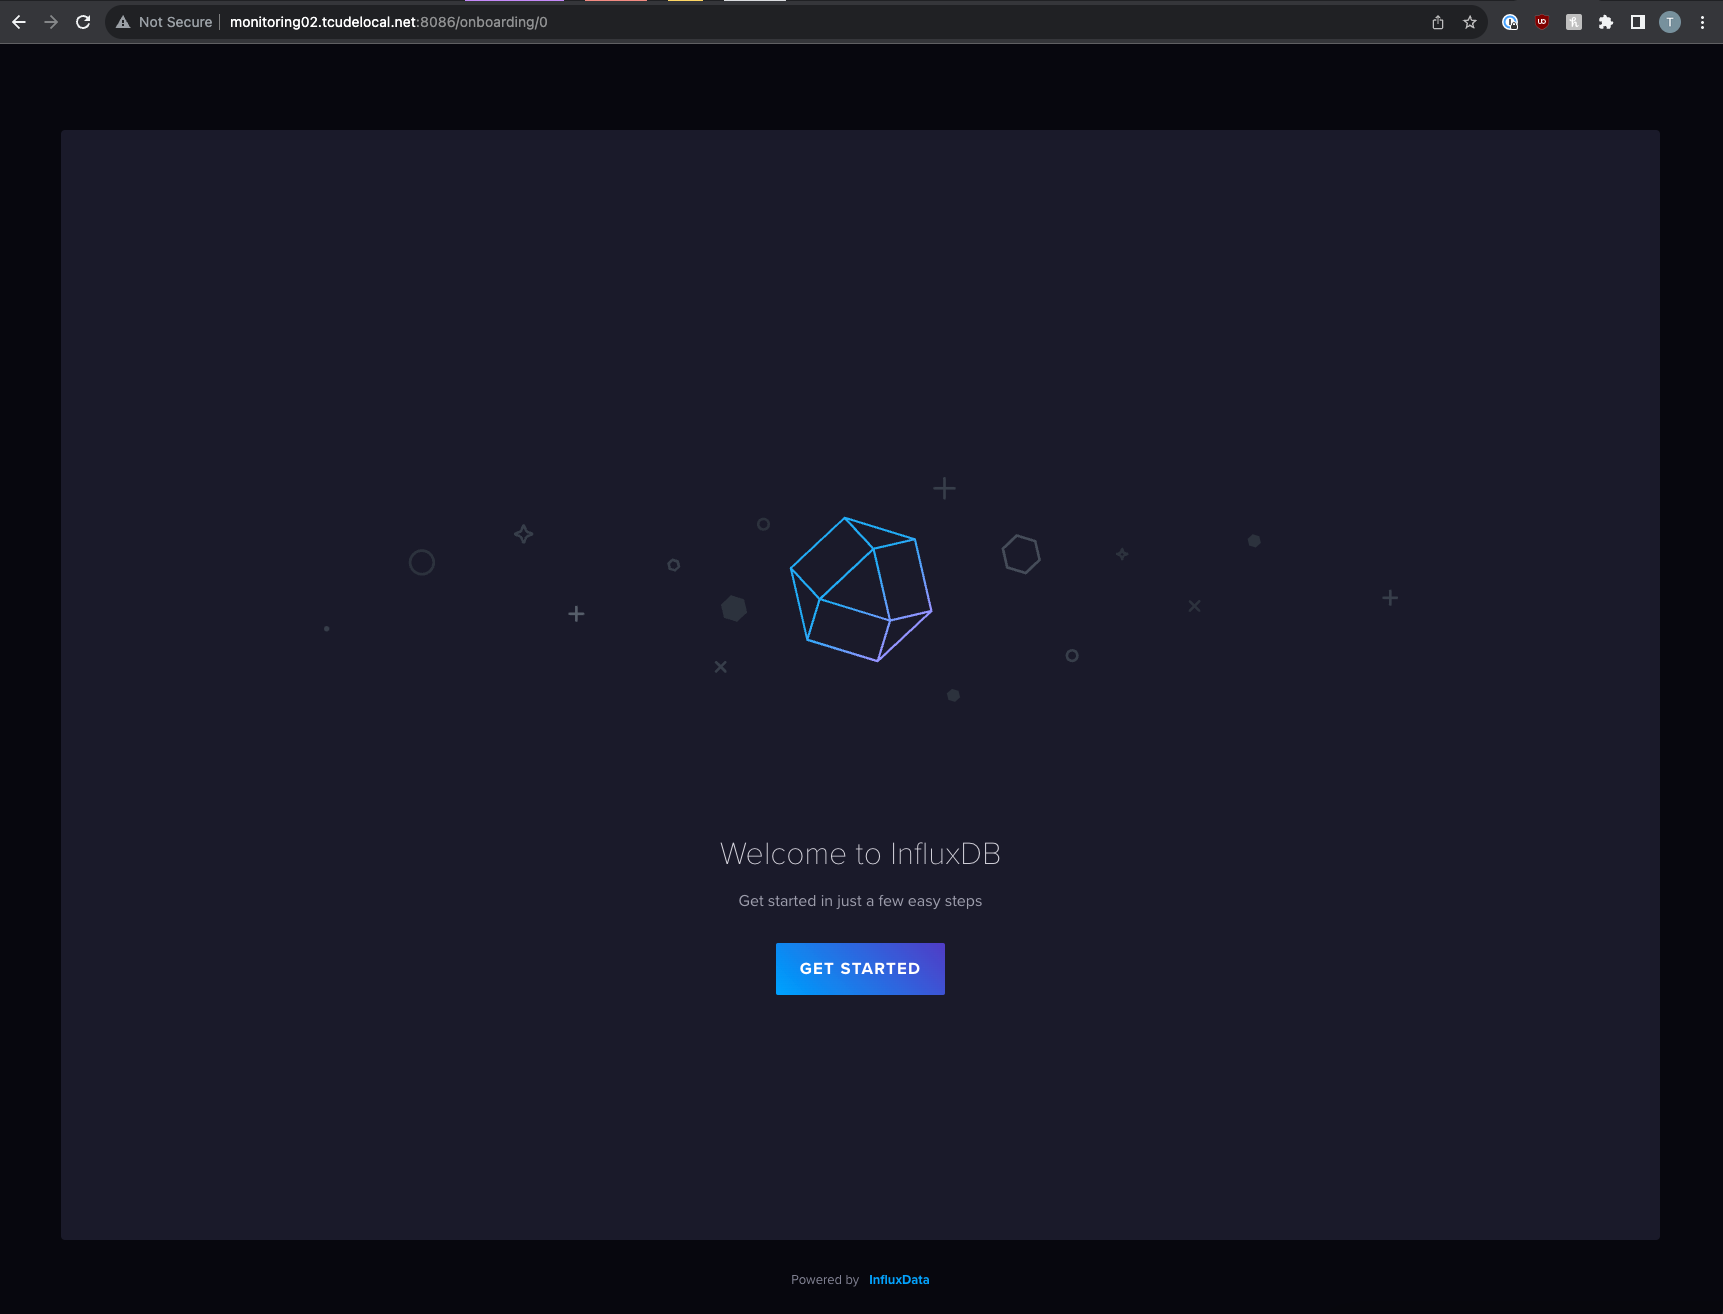
Follow the straightforward setup process, making note of all the details for use in later steps.
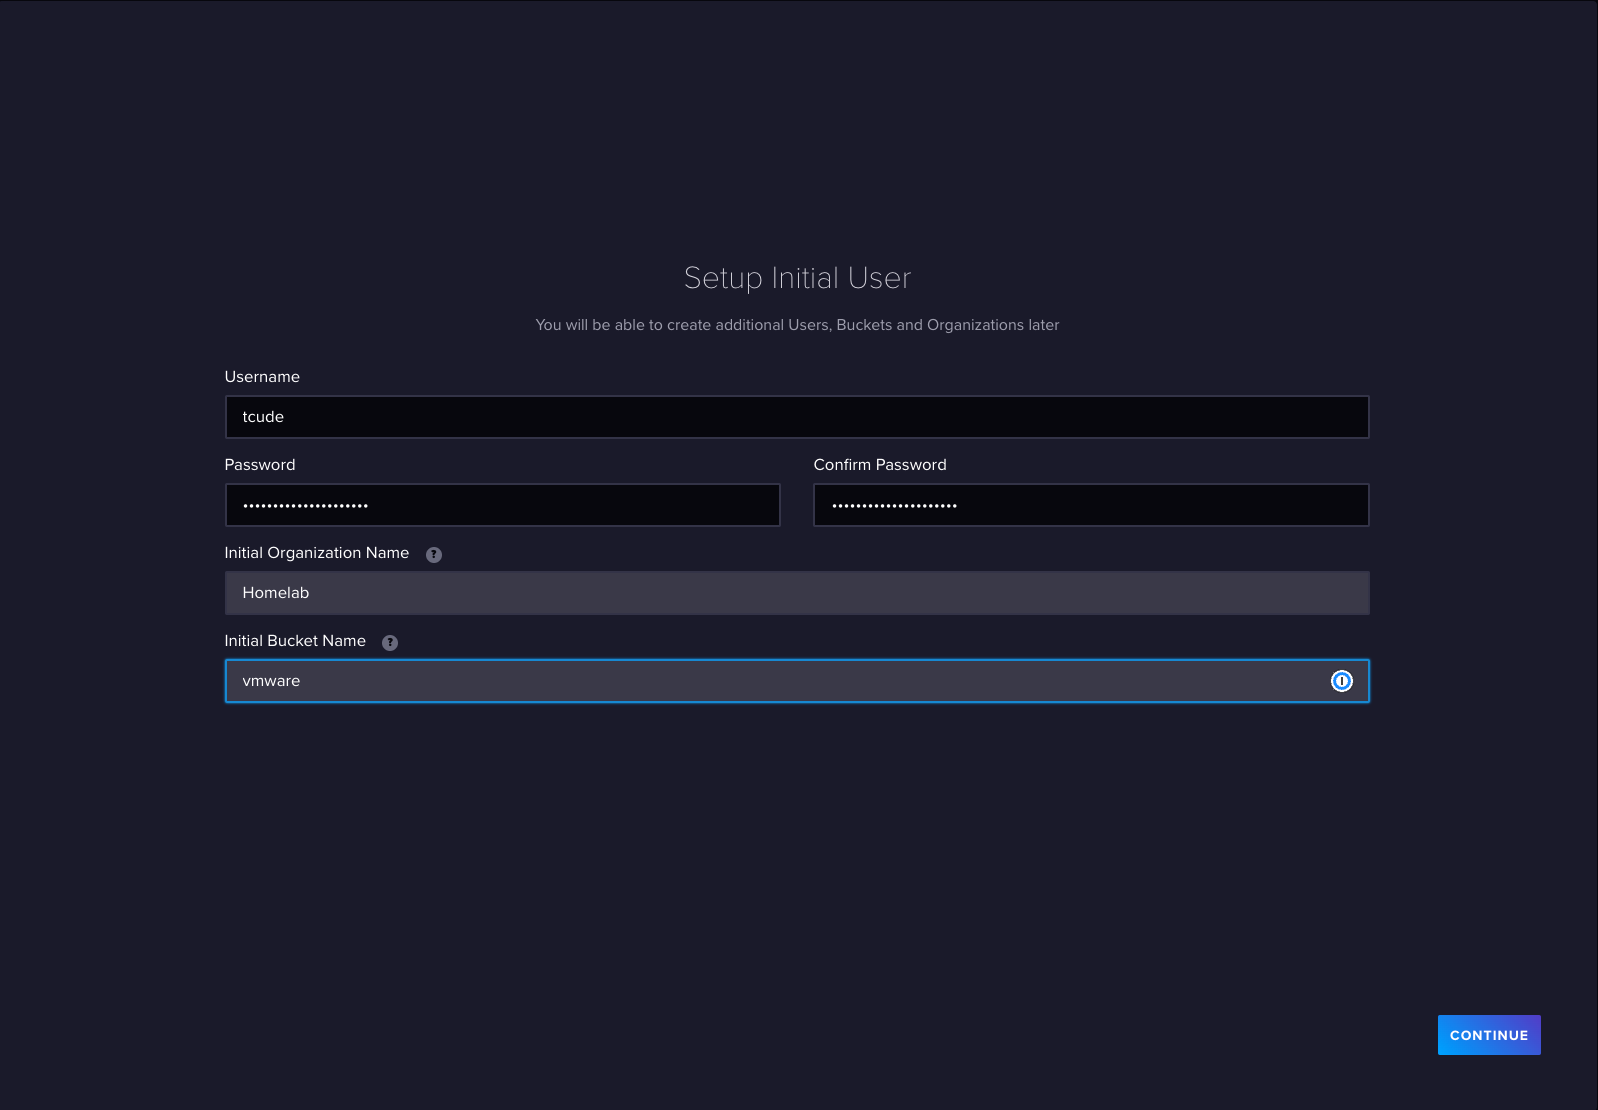
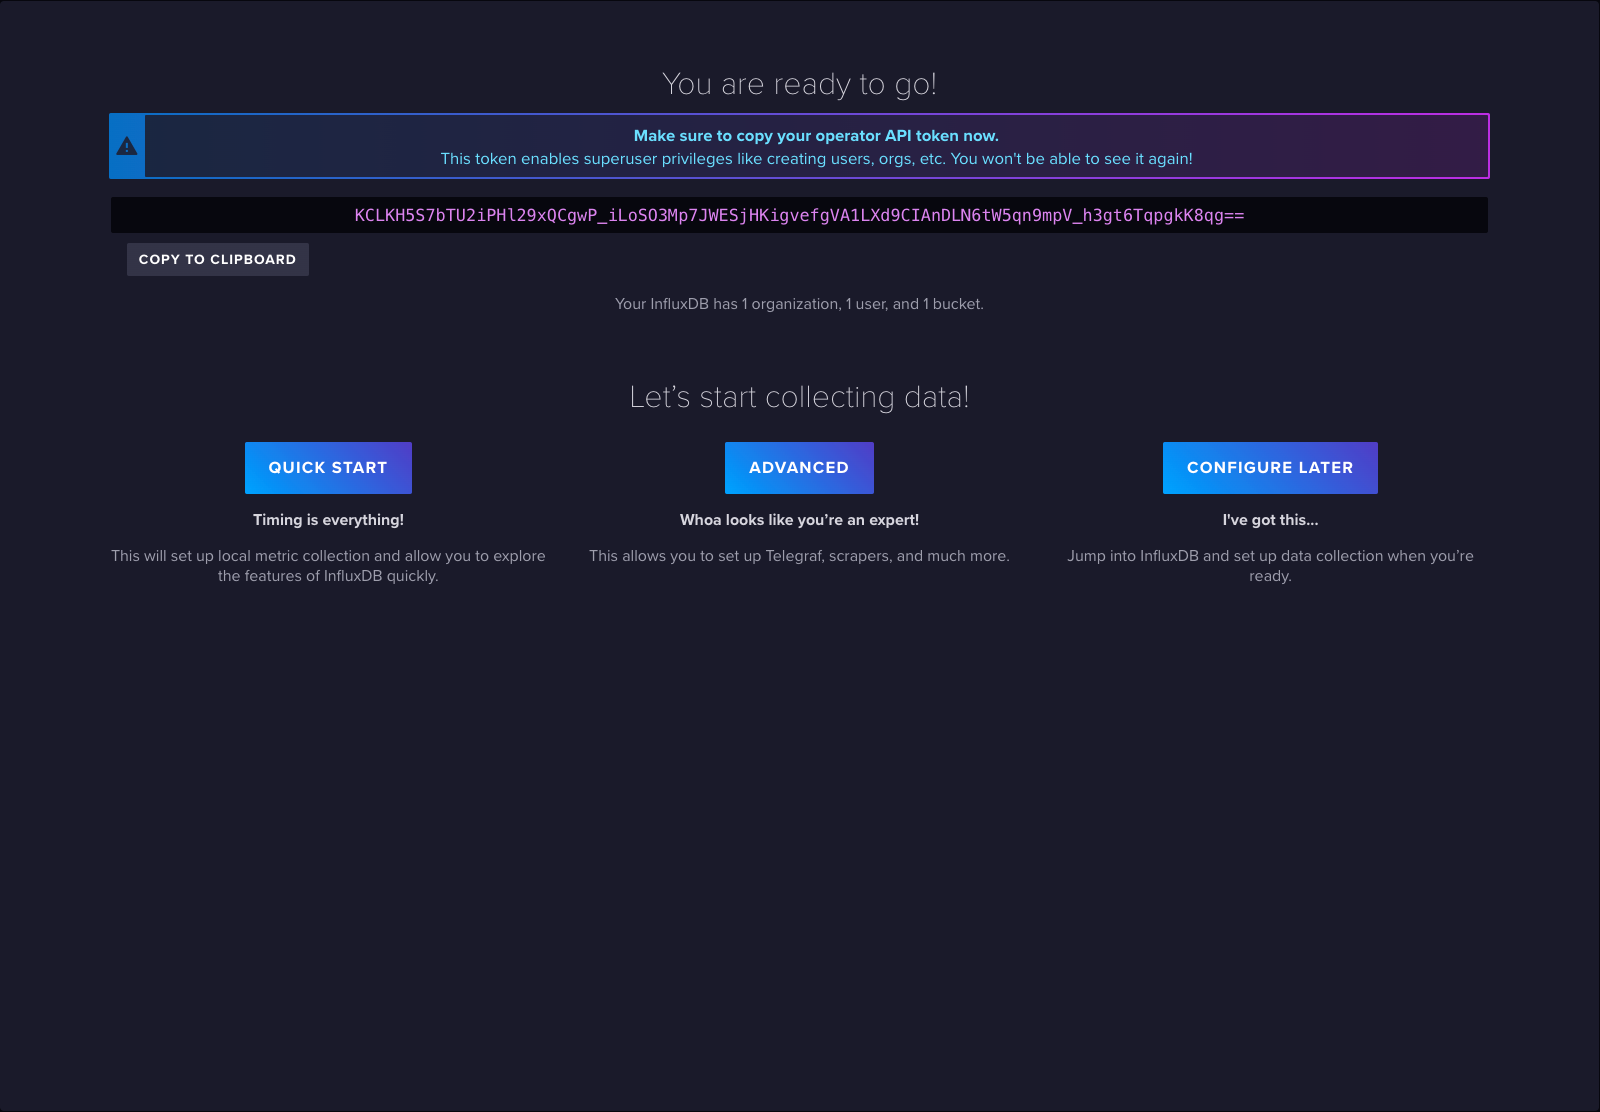
Once submitted, you will be presented with an API token. Keep this stashed away, as well.
Configuring Telegraf
Now it is time to configure Telegraf. To do this, you will need to go back to your terminal and revisit the telegraf.conf file we created earlier. Start by populating it with the following:
[outputs.influxdb_v2]
   urls = ["http://your_influxdb_host:8086"]
   ## Token for authentication.
   token = "your_token_here"
   ## Organization is the name of the organization you wish to write to; must exist.
   organization = "Homelab"
   ## Destination bucket to write into.
   bucket = "vmware"
Additionally, after the outputs block, add the following inputs block:
# Read metrics from VMware vCenter
 [[inputs.vsphere]]
 ## List of vCenter URLs to be monitored. These three lines must be uncommented
 ## and edited for the plugin to work.
 vcenters = [ "https://<vcenter_hostname>/sdk" ]
    username = "[email protected]"
    password = "password_here"
 #
 ## VMs
 ## Typical VM metrics (if omitted or empty, all metrics are collected)
 vm_metric_include = [
      "cpu.demand.average",
      "cpu.idle.summation",
      "cpu.latency.average",
      "cpu.readiness.average",
      "cpu.ready.summation",
      "cpu.run.summation",
      "cpu.usagemhz.average",
      "cpu.used.summation",
      "cpu.wait.summation",
      "mem.active.average",
      "mem.granted.average",
      "mem.latency.average",
      "mem.swapin.average",
      "mem.swapinRate.average",
      "mem.swapout.average",
      "mem.swapoutRate.average",
      "mem.usage.average",
      "mem.vmmemctl.average",
      "net.bytesRx.average",
      "net.bytesTx.average",
      "net.droppedRx.summation",
      "net.droppedTx.summation",
      "net.usage.average",
      "power.power.average",
      "virtualDisk.numberReadAveraged.average",
      "virtualDisk.numberWriteAveraged.average",
      "virtualDisk.read.average",
      "virtualDisk.readOIO.latest",
      "virtualDisk.throughput.usage.average",
      "virtualDisk.totalReadLatency.average",
      "virtualDisk.totalWriteLatency.average",
      "virtualDisk.write.average",
      "virtualDisk.writeOIO.latest",
      "sys.uptime.latest",
    ]
 # vm_metric_exclude = [] ## Nothing is excluded by default
 # vm_instances = true ## true by default
 #
 ## Hosts
 ## Typical host metrics (if omitted or empty, all metrics are collected)
 host_metric_include = [
      "cpu.coreUtilization.average",
      "cpu.costop.summation",
      "cpu.demand.average",
      "cpu.idle.summation",
      "cpu.latency.average",
      "cpu.readiness.average",
      "cpu.ready.summation",
      "cpu.swapwait.summation",
      "cpu.usage.average",
      "cpu.usagemhz.average",
      "cpu.used.summation",
      "cpu.utilization.average",
      "cpu.wait.summation",
      "disk.deviceReadLatency.average",
      "disk.deviceWriteLatency.average",
      "disk.kernelReadLatency.average",
      "disk.kernelWriteLatency.average",
      "disk.numberReadAveraged.average",
      "disk.numberWriteAveraged.average",
      "disk.read.average",
      "disk.totalReadLatency.average",
      "disk.totalWriteLatency.average",
      "disk.write.average",
      "mem.active.average",
      "mem.latency.average",
      "mem.state.latest",
      "mem.swapin.average",
      "mem.swapinRate.average",
      "mem.swapout.average",
      "mem.swapoutRate.average",
      "mem.totalCapacity.average",
      "mem.usage.average",
      "mem.vmmemctl.average",
      "net.bytesRx.average",
      "net.bytesTx.average",
      "net.droppedRx.summation",
      "net.droppedTx.summation",
      "net.errorsRx.summation",
      "net.errorsTx.summation",
      "net.usage.average",
      "power.power.average",
      "storageAdapter.numberReadAveraged.average",
      "storageAdapter.numberWriteAveraged.average",
      "storageAdapter.read.average",
      "storageAdapter.write.average",
      "sys.uptime.latest",
    ]
 # host_metric_exclude = [] ## Nothing excluded by default
 # host_instances = true ## true by default
 #
 ## Clusters
 cluster_metric_include = [] ## if omitted or empty, all metrics are collected
 # cluster_metric_exclude = [] ## Nothing excluded by default
 # cluster_instances = false ## false by default
 #
 ## Datastores
 datastore_metric_include = [] ## if omitted or empty, all metrics are collected
 # datastore_metric_exclude = [] ## Nothing excluded by default
 # datastore_instances = false ## false by default for Datastores only
 #
 ## Datacenters
 datacenter_metric_include = [] ## if omitted or empty, all metrics are collected
# datacenter_metric_exclude = [ "*" ] ## Datacenters are not collected by default.
 # datacenter_instances = false ## false by default for Datastores only
 #
 ## Plugin Settings
 ## separator character to use for measurement and field names (default: "_")
 # separator = "_"
 #
 ## number of objects to retreive per query for realtime resources (vms and hosts)
 ## set to 64 for vCenter 5.5 and 6.0 (default: 256)
 # max_query_objects = 256
 #
 ## number of metrics to retreive per query for non-realtime resources (clusters and datastores)
 ## set to 64 for vCenter 5.5 and 6.0 (default: 256)
 # max_query_metrics = 256
 #
 ## number of go routines to use for collection and discovery of objects and metrics
 # collect_concurrency = 1
 # discover_concurrency = 1
 #
 ## whether or not to force discovery of new objects on initial gather call before collecting metrics
 ## when true for large environments this may cause errors for time elapsed while collecting metrics
 ## when false (default) the first collection cycle may result in no or limited metrics while objects are discovered
 # force_discover_on_init = false
 #
 ## the interval before (re)discovering objects subject to metrics collection (default: 300s)
 # object_discovery_interval = "300s"
 #
 ## timeout applies to any of the api request made to vcenter
 # timeout = "60s"
 #
 ## Optional SSL Config
 # ssl_ca = "/path/to/cafile"
 # ssl_cert = "/path/to/certfile"
 # ssl_key = "/path/to/keyfile"
 ## Use SSL but skip chain & host verification
 insecure_skip_verify = true
Note that using insecure_skip_verify = true is for use with a self signed certificate. You will likely already know if this needs to be set to false for your environment.
Restart the Telegraf container to apply the new configuration:docker compose restart telegraf
Let's check to see if data is flowing correctly. To do this, you can run docker ps to get the container ID of Telegraf:
tcude@monitoring02:~/monitoring$ docker ps
CONTAINER ID   IMAGE             COMMAND                  CREATED          STATUS          PORTS                                                                                  NAMES
7d9bf5c686ce   telegraf          "/entrypoint.sh tele…"   32 minutes ago   Up 16 seconds   8092/udp, 8125/udp, 8094/tcp                                                           telegraf_container
718bb1181c55   grafana/grafana   "/run.sh"                32 minutes ago   Up 32 minutes   0.0.0.0:3000->3000/tcp, :::3000->3000/tcp                                              grafana_container
55949c1ea88b   influxdb          "/entrypoint.sh infl…"   32 minutes ago   Up 32 minutes   0.0.0.0:8086->8086/tcp, :::8086->8086/tcp, 0.0.0.0:8089->8089/udp, :::8089->8089/udp   influxdb_container
For my setup, Telegraf has an ID of 7d9bf5c686ce. Knowing the container ID, you can now run docker logs <container_id>. You should see something similar to this:
2023-12-08T15:28:09Z I! Loading config: /etc/telegraf/telegraf.conf
2023-12-08T15:28:09Z W! DeprecationWarning: Option "force_discover_on_init" of plugin "inputs.vsphere" deprecated since version 1.14.0 and will be removed in 2.0.0: option is ignored
2023-12-08T15:28:09Z I! Starting Telegraf 1.28.5 brought to you by InfluxData the makers of InfluxDB
2023-12-08T15:28:09Z I! Available plugins: 240 inputs, 9 aggregators, 29 processors, 24 parsers, 59 outputs, 5 secret-stores
2023-12-08T15:28:09Z I! Loaded inputs: vsphere
2023-12-08T15:28:09Z I! Loaded aggregators:
2023-12-08T15:28:09Z I! Loaded processors:
2023-12-08T15:28:09Z I! Loaded secretstores:
2023-12-08T15:28:09Z I! Loaded outputs: influxdb_v2
2023-12-08T15:28:09Z I! Tags enabled: host=7d9bf5c686ce
2023-12-08T15:28:09Z W! Deprecated inputs: 0 and 1 options
2023-12-08T15:28:09Z I! [agent] Config: Interval:10s, Quiet:false, Hostname:"7d9bf5c686ce", Flush Interval:10s
2023-12-08T15:28:09Z I! [inputs.vsphere] Starting plugin
Telegraf picked up the telegraf.conf file and everything looks good.
With InfluxDB up and Telegraf providing data to it, we can now set up Grafana!
Setting up Grafana
Access Grafana at http://<your_hostname>:3000 (default credentials: admin/admin).
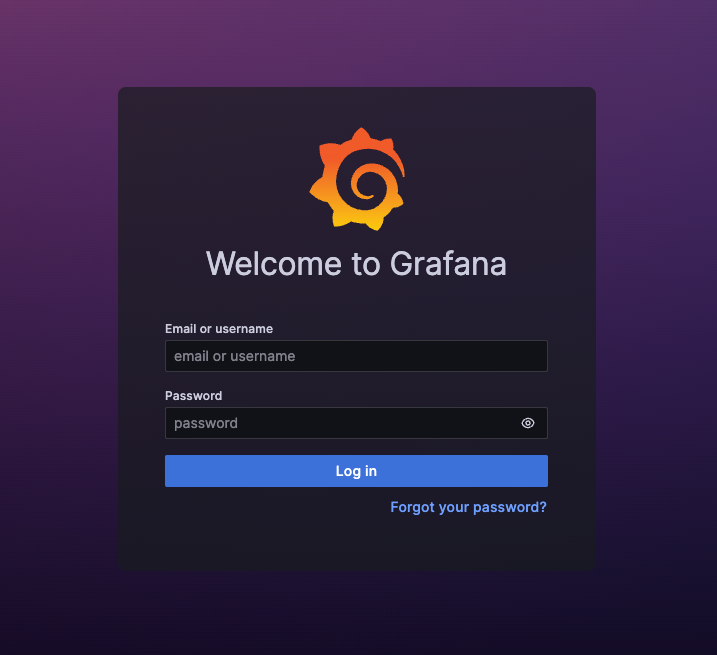
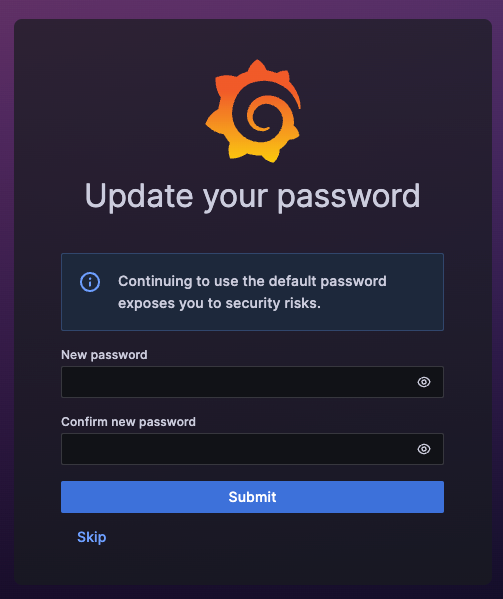
Change the default password for security.
Once logged in, visit the left hand menu of the home page. Under the Connections section, select Data sources and then Add data sources
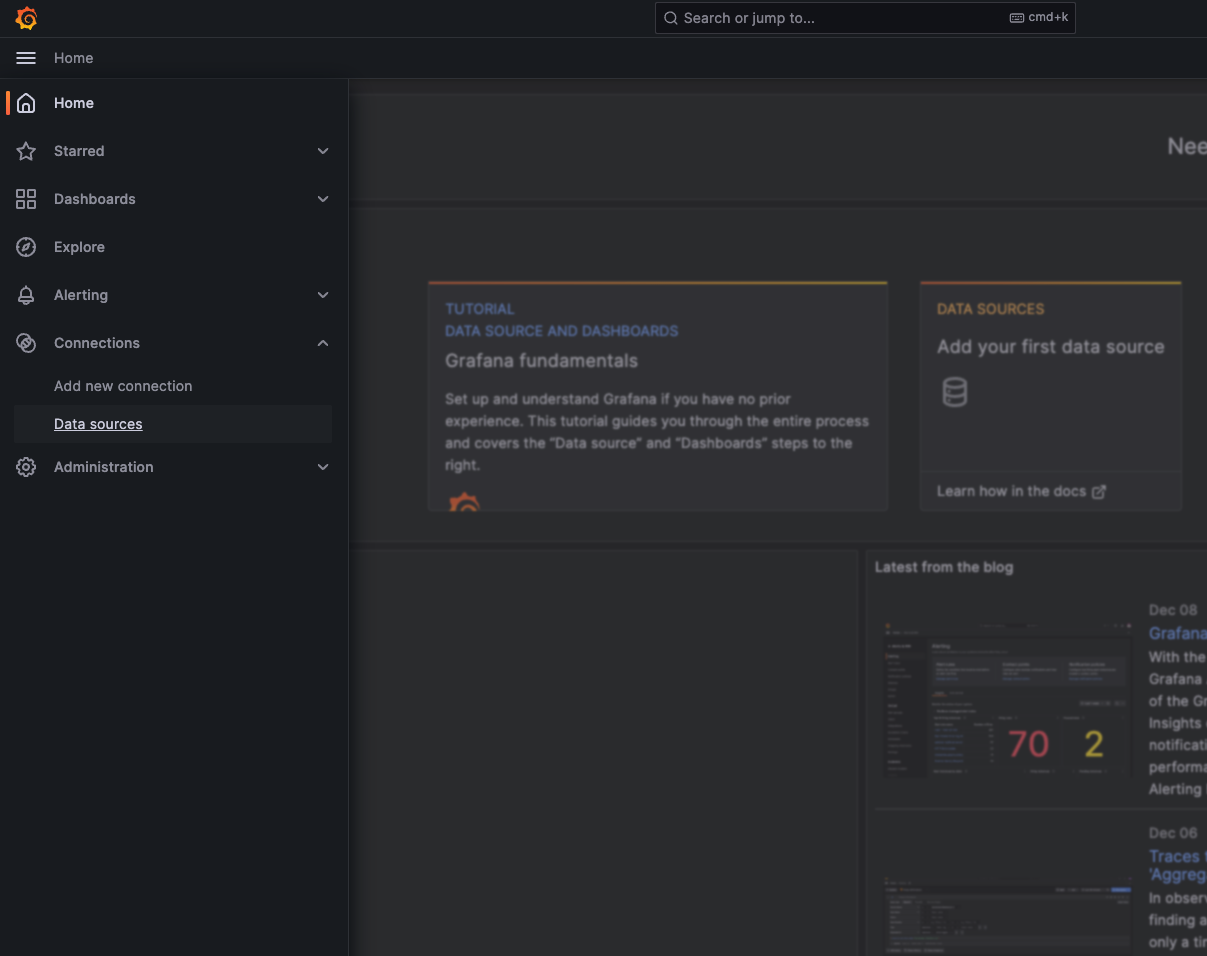
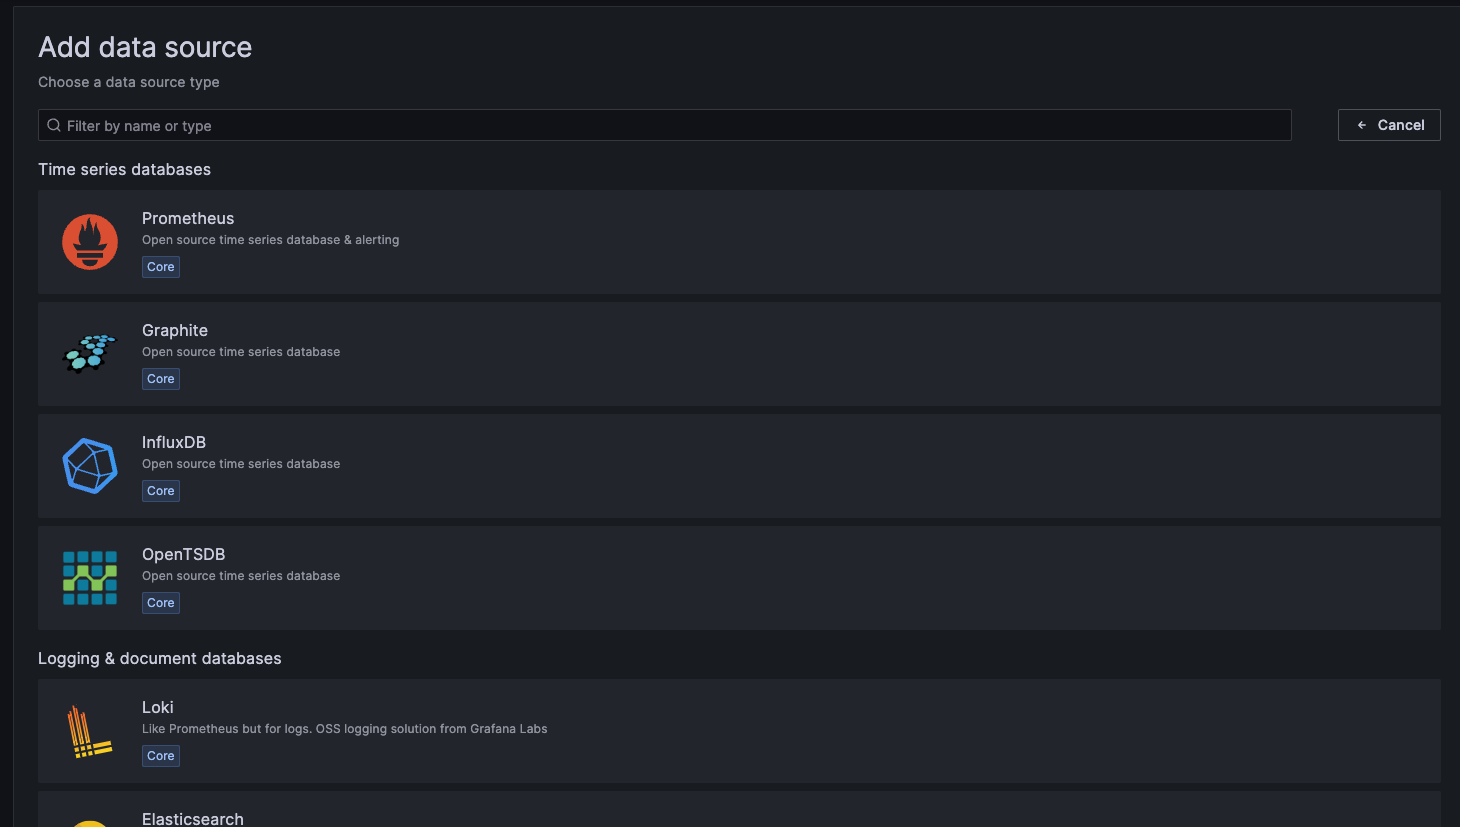
You will now be presented with a list of possible data source options. Select InfluxDB
You will now want to configure your InfluxDB data source similar to what I have here:
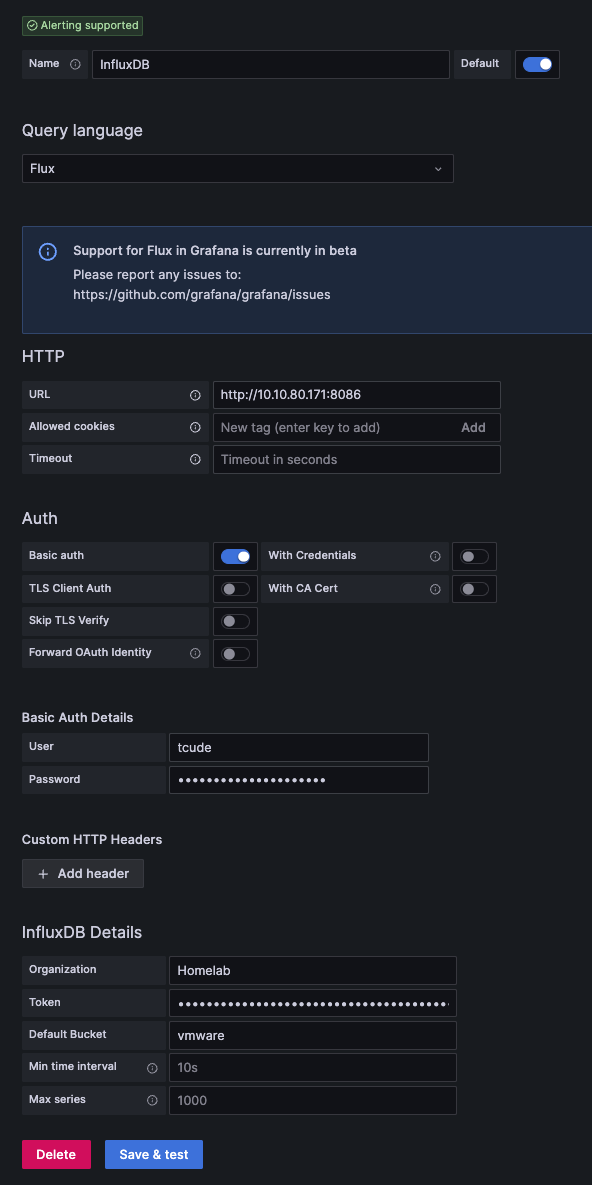
There are a couple of things worth noting here:
The Query language will default to InfluxQL. I have changed this to Flux. InfluxQL is a SQL-like query language for interacting with InfluxDB, focusing on simplicity and ease of use, whereas Flux is a newer, more powerful and functional data scripting language designed for complex data processing, transformations, and analytics with InfluxDB.
Other than that, you will just need to provide your InfluxDB username and password in the Basic Auth Details section.
Under InfluxDB Details, you will use the same values we used earlier. The Token field needs to be populated with the API token value that we received earlier.
With that all out of the way, you should now be able to click Save & test
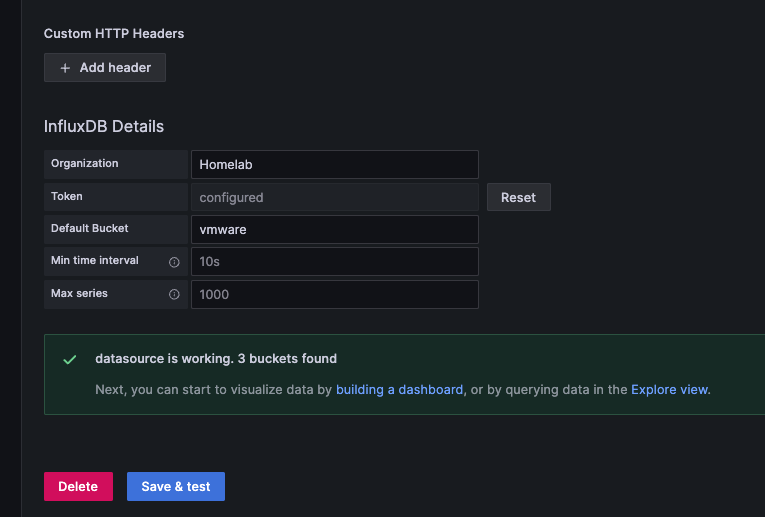
Assuming everything is configured correctly, you should see something similar to the image above.
Setting up a Dashboard in Grafana
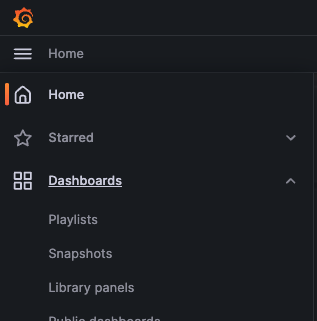
With the hard part out of the way, it is time to load up a dashboard! To start, using the same left-hand menu, select Dashboards
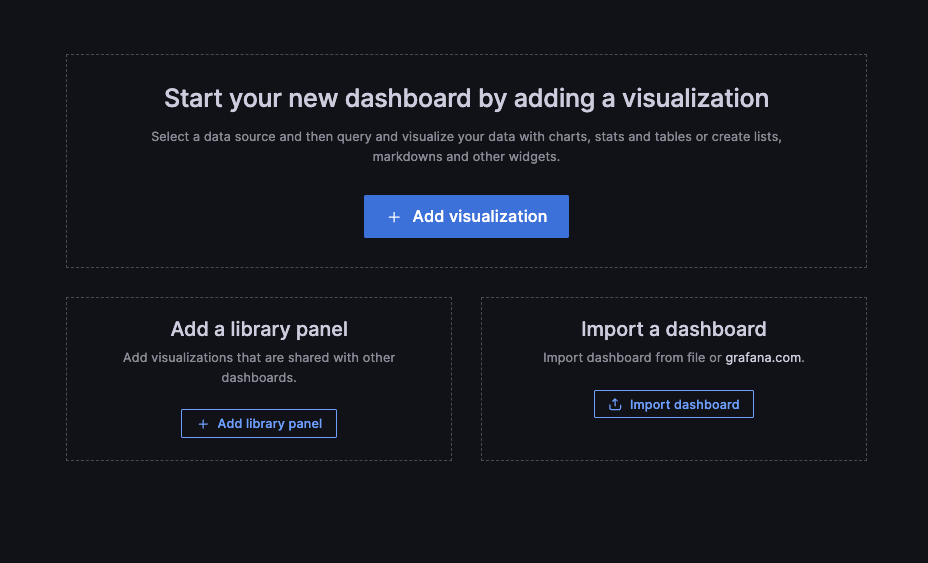
Select Create Dashboard
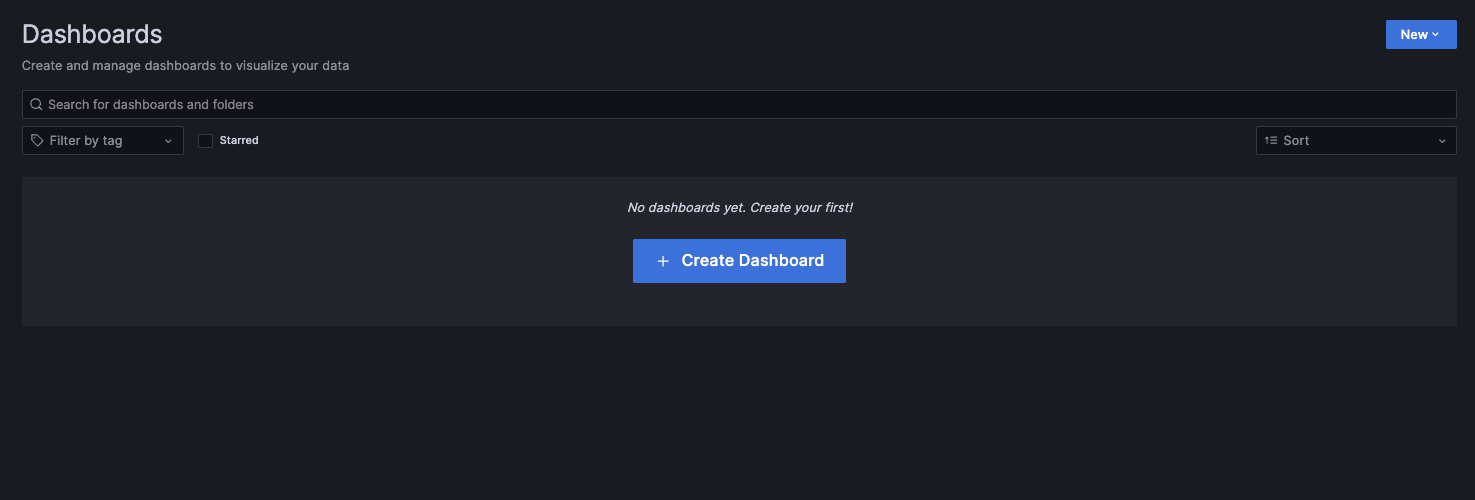
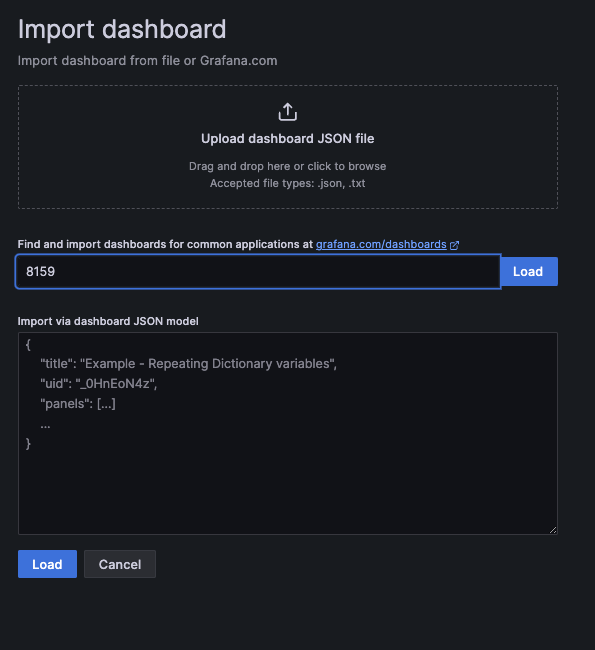
While you can choose the route of manually creating a dashboard, there are also many pre-made dashboards that you can use to get up and running immediately. These can be viewed by clicking Import dashboard
From here, you can search for the ID of the dashboard you want to use. For my purposes, I'm going to start with this dashboard, which can be searched for using the id of 8159.
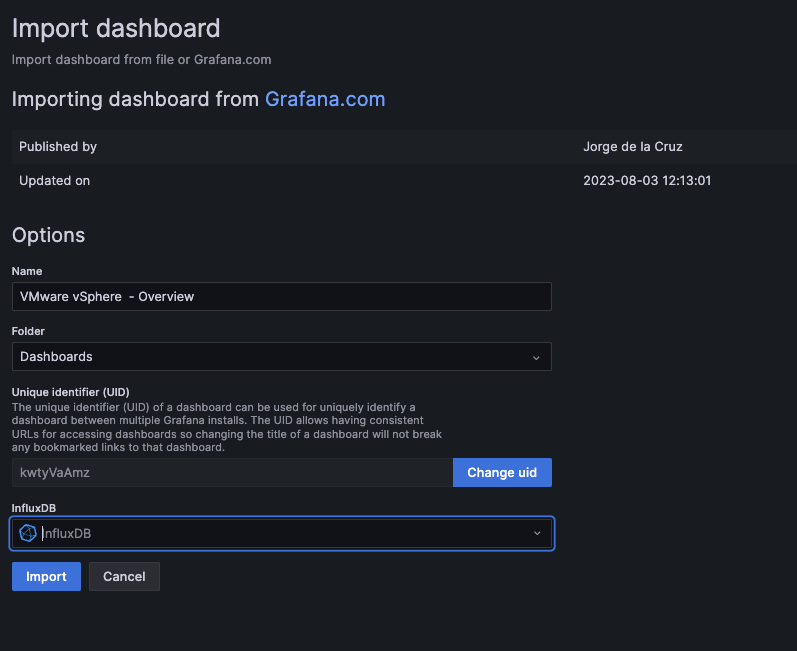
All that is left is to, under InfluxDB, select your InfluxDB data source. Then click Import
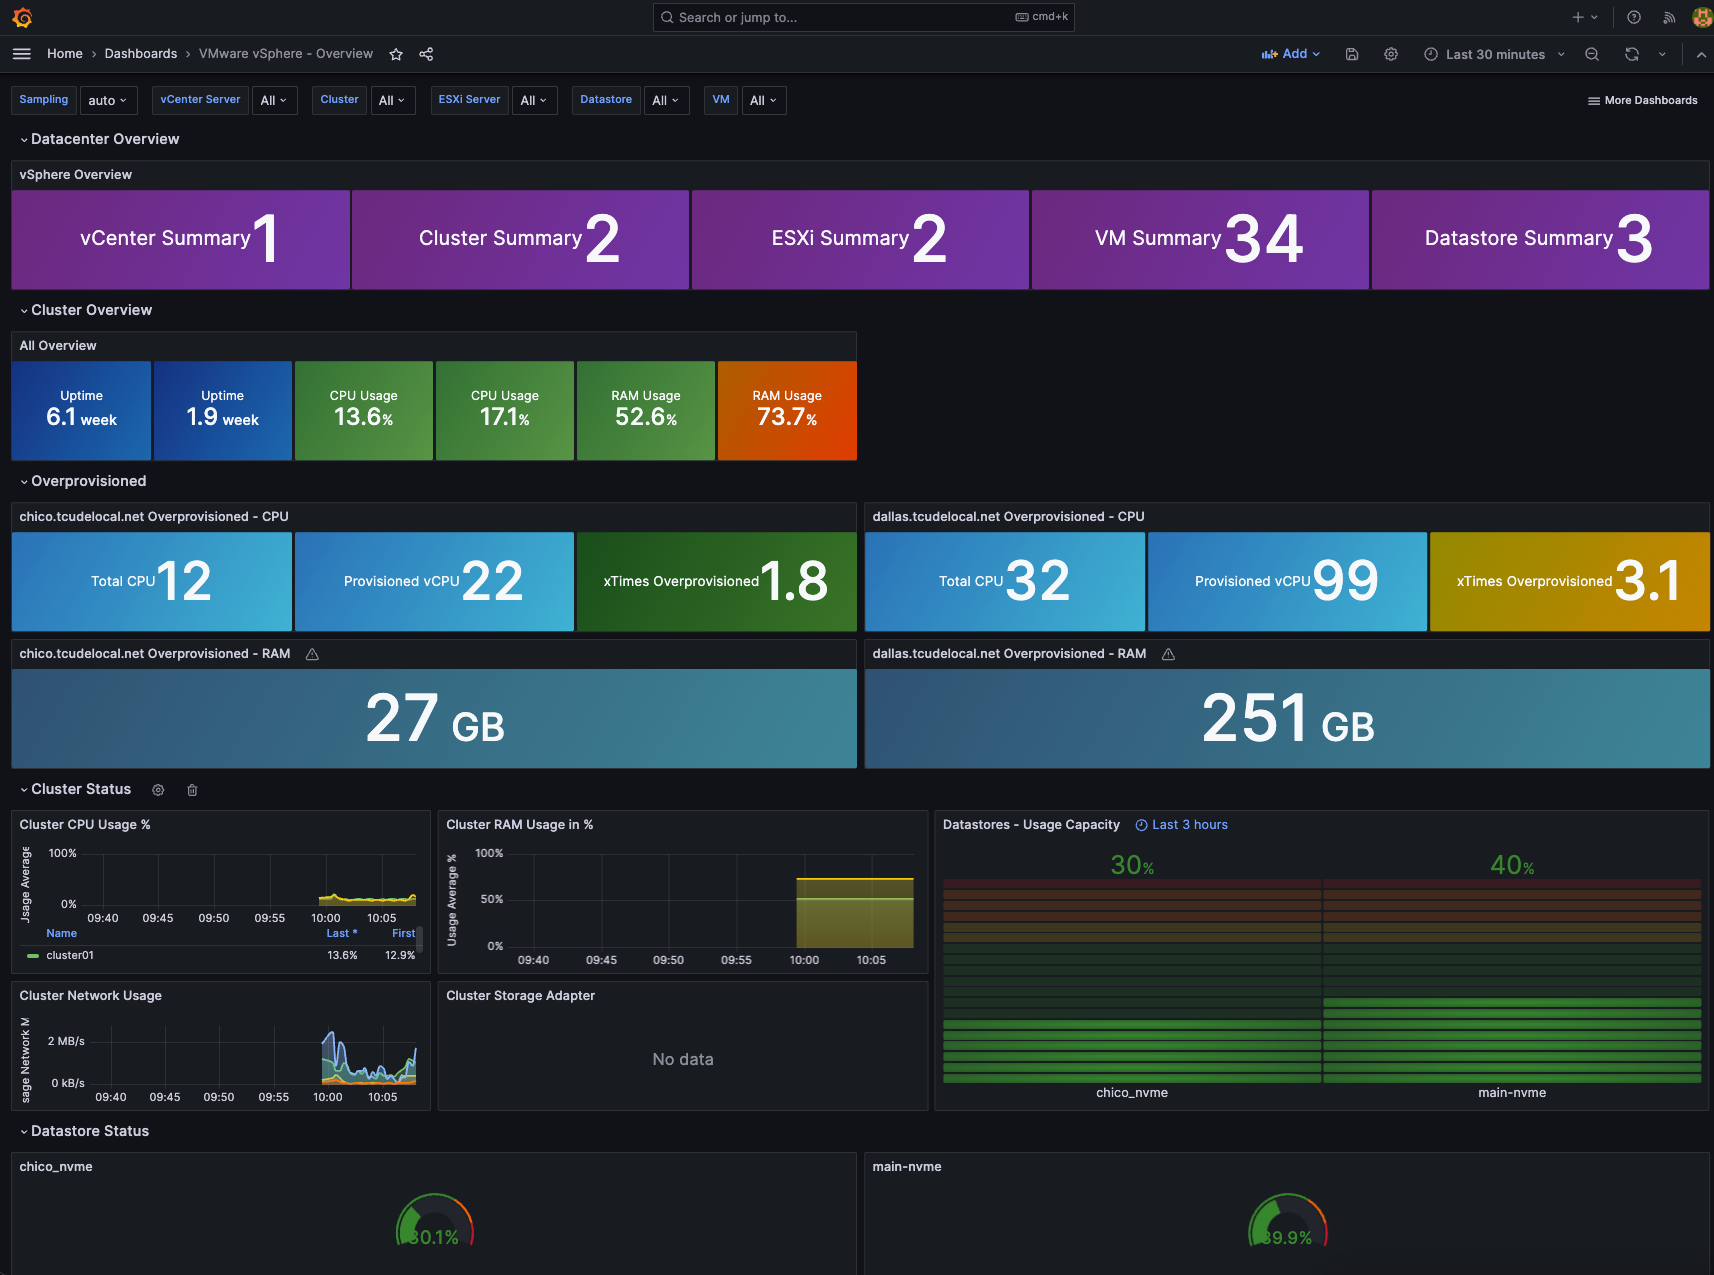
Conclusion
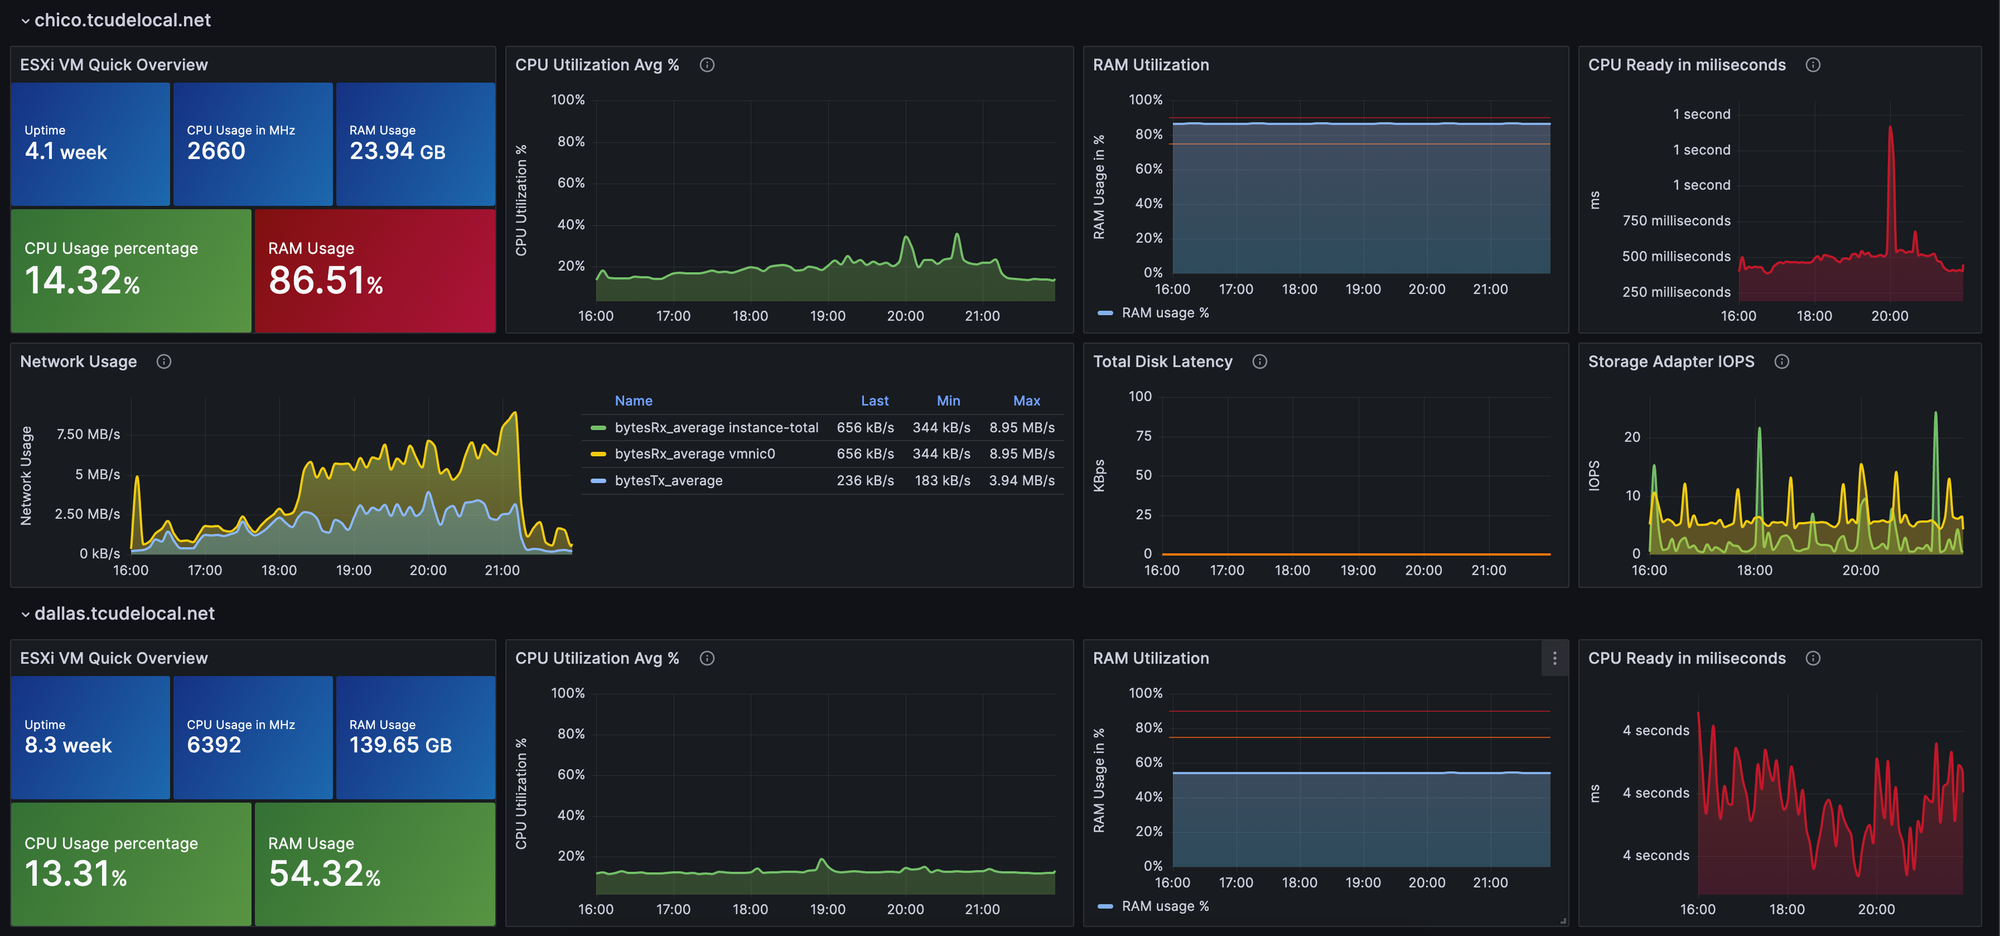
With that, you should now have a working Grafana dashboard!
Here are some of the other great VMWare dashboards I have found:
- Grafana vSphere Datastore Dashboard – 8162
- Grafana vSphere Hosts Dashboard – 8165
- Grafana vSphere VMs Dashboard – 8168
Special thanks to Jorge de la Cruz for creating these fantastic dashboards! Check out their blog here: