Monitoring Proxmox with InfluxDB and Grafana

As I have continued to learn and build up my Proxmox lab environment, I have been looking at different options for me to be able to more closely keep track of various metrics within my lab. Ultimately, I decided that I was intent on getting Grafana up and running.
Even prior to my migration to Proxmox, Grafana had always seemed appealing. With my employer also using Grafana in a production setting, it was just another incentive to get the ball rolling on this project to get it set up at home.
Fortunately for me, and you, as well, if you are running Proxmox, the process of setting this up was a bit easier than I had previously anticipated due to the out of the box integration of InfluxDB within Proxmox.
Let's get started!
Installing InfluxDB and Grafana
To start, you will need a host that is running docker, as well as docker-compose. Assuming those prerequisites are met, utilize this following docker-compose file in order to spin up InfluxDB and Grafana:
version: "3"
services:
  grafana:
    image: grafana/grafana
    container_name: grafana_container
    restart: always
    ports:
      - 3000:3000
    networks:
      - monitoring_network
    volumes:
      - grafana-volume:/var/lib/grafana
  influxdb:
    image: influxdb
    container_name: influxdb_container
    restart: always
    ports:
      - 8086:8086
      - 8089:8089/udp
    networks:
      - monitoring_network
    volumes:
      - influxdb-volume:/var/lib/influxdb
networks:
  monitoring_network:
volumes:
  grafana-volume:
    external: true
  influxdb-volume:
    external: true
You will also need to create the docker volumes referenced above:
  docker volume create influxdb-volume
  docker volume create grafana-volume
As well as creating the monitoring network that Grafana and InfluxDB will share:
docker network create monitoring_networkOnce done, it should simply be a matter of running docker-compose up -d in order to bring both containers up.
Configuring InfluxDB
Once your containers are online, visit <hostname>:8086, specify an organization name and a bucket name. For my purposes, I set my organization name to Homelab and bucket name to proxmox. Make note of these, as you will need them for later steps.
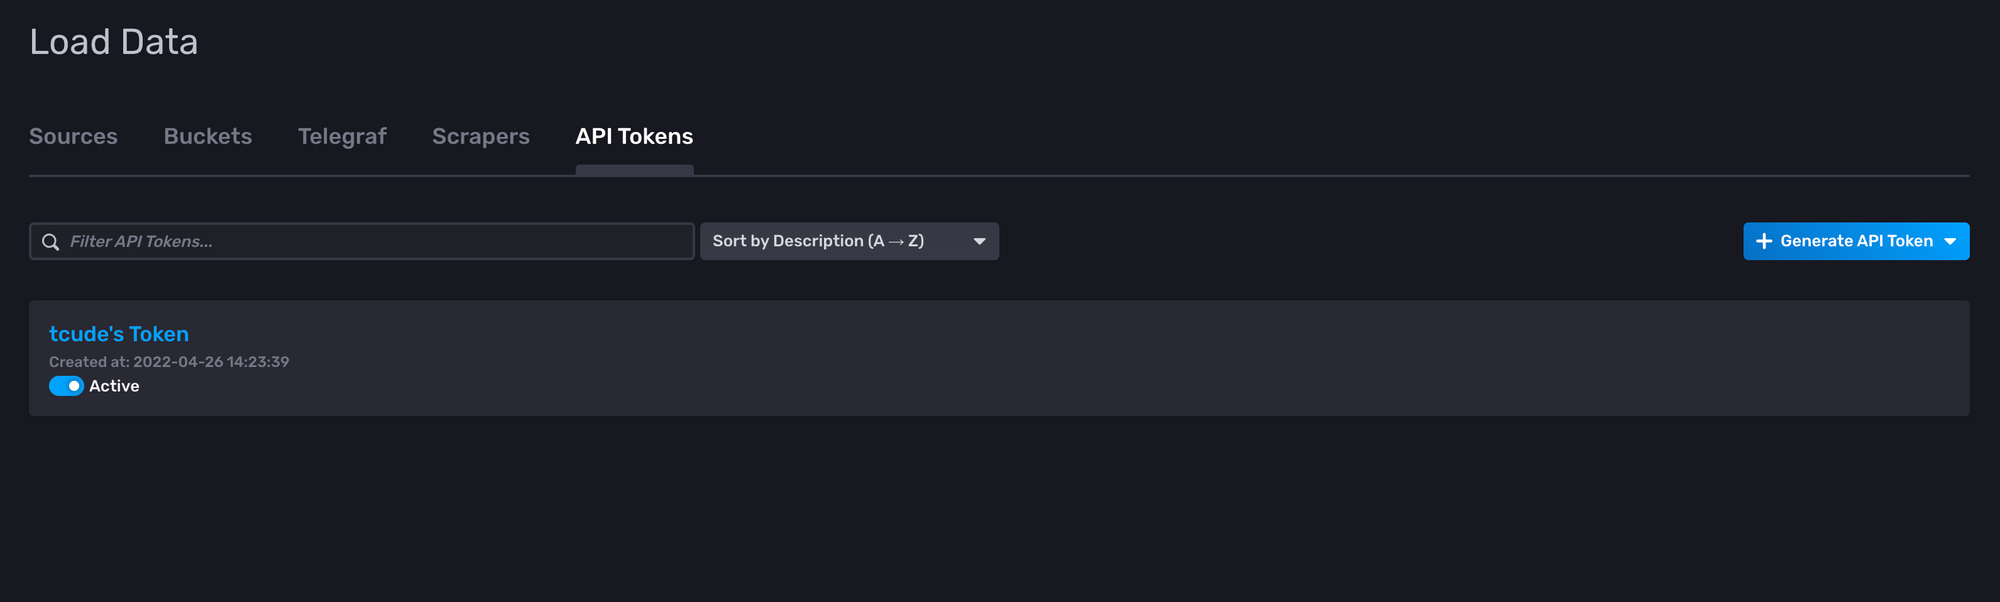
Once configured, you will need to visit the following screen under the "Data" tab and then click on the "API Tokens" tab at the top:
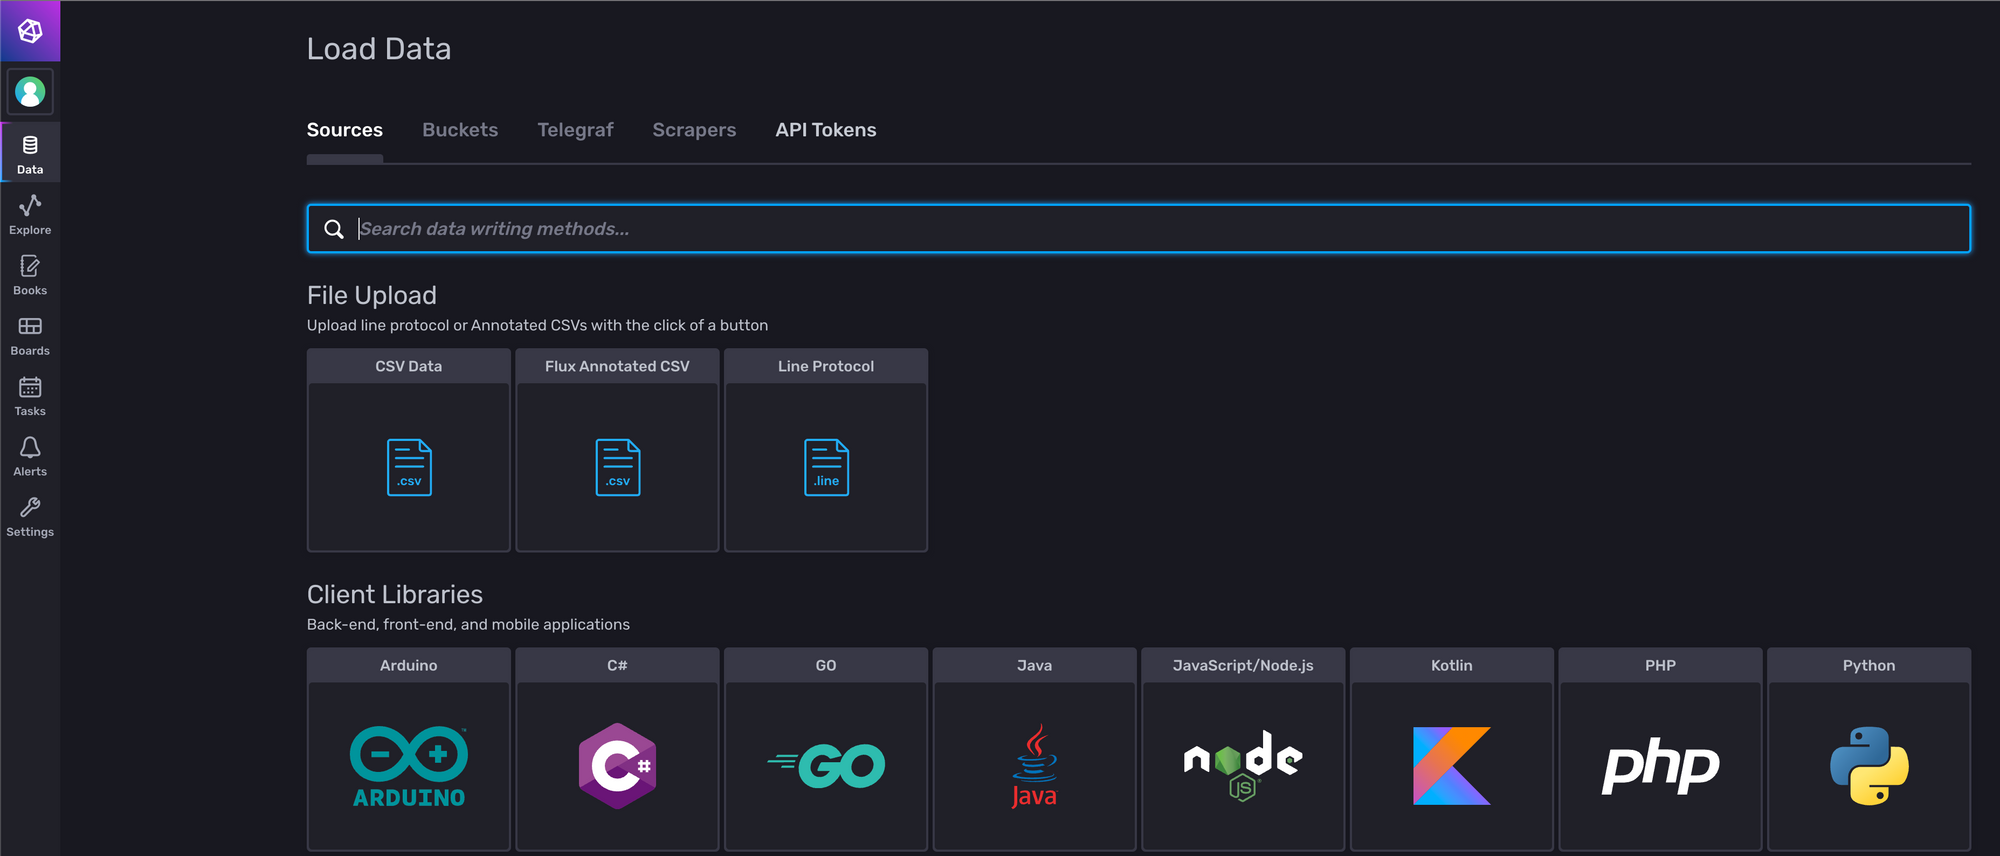
Here, your user should have a token created with your user's name (which was defined on the setup screen). Click on it and then copy your token, as it will be needed in the next step.
Setting up InfluxDB within Proxmox
Now that you have InfluxDB created, with your API token copied, it is time to go back to your Proxmox instance:
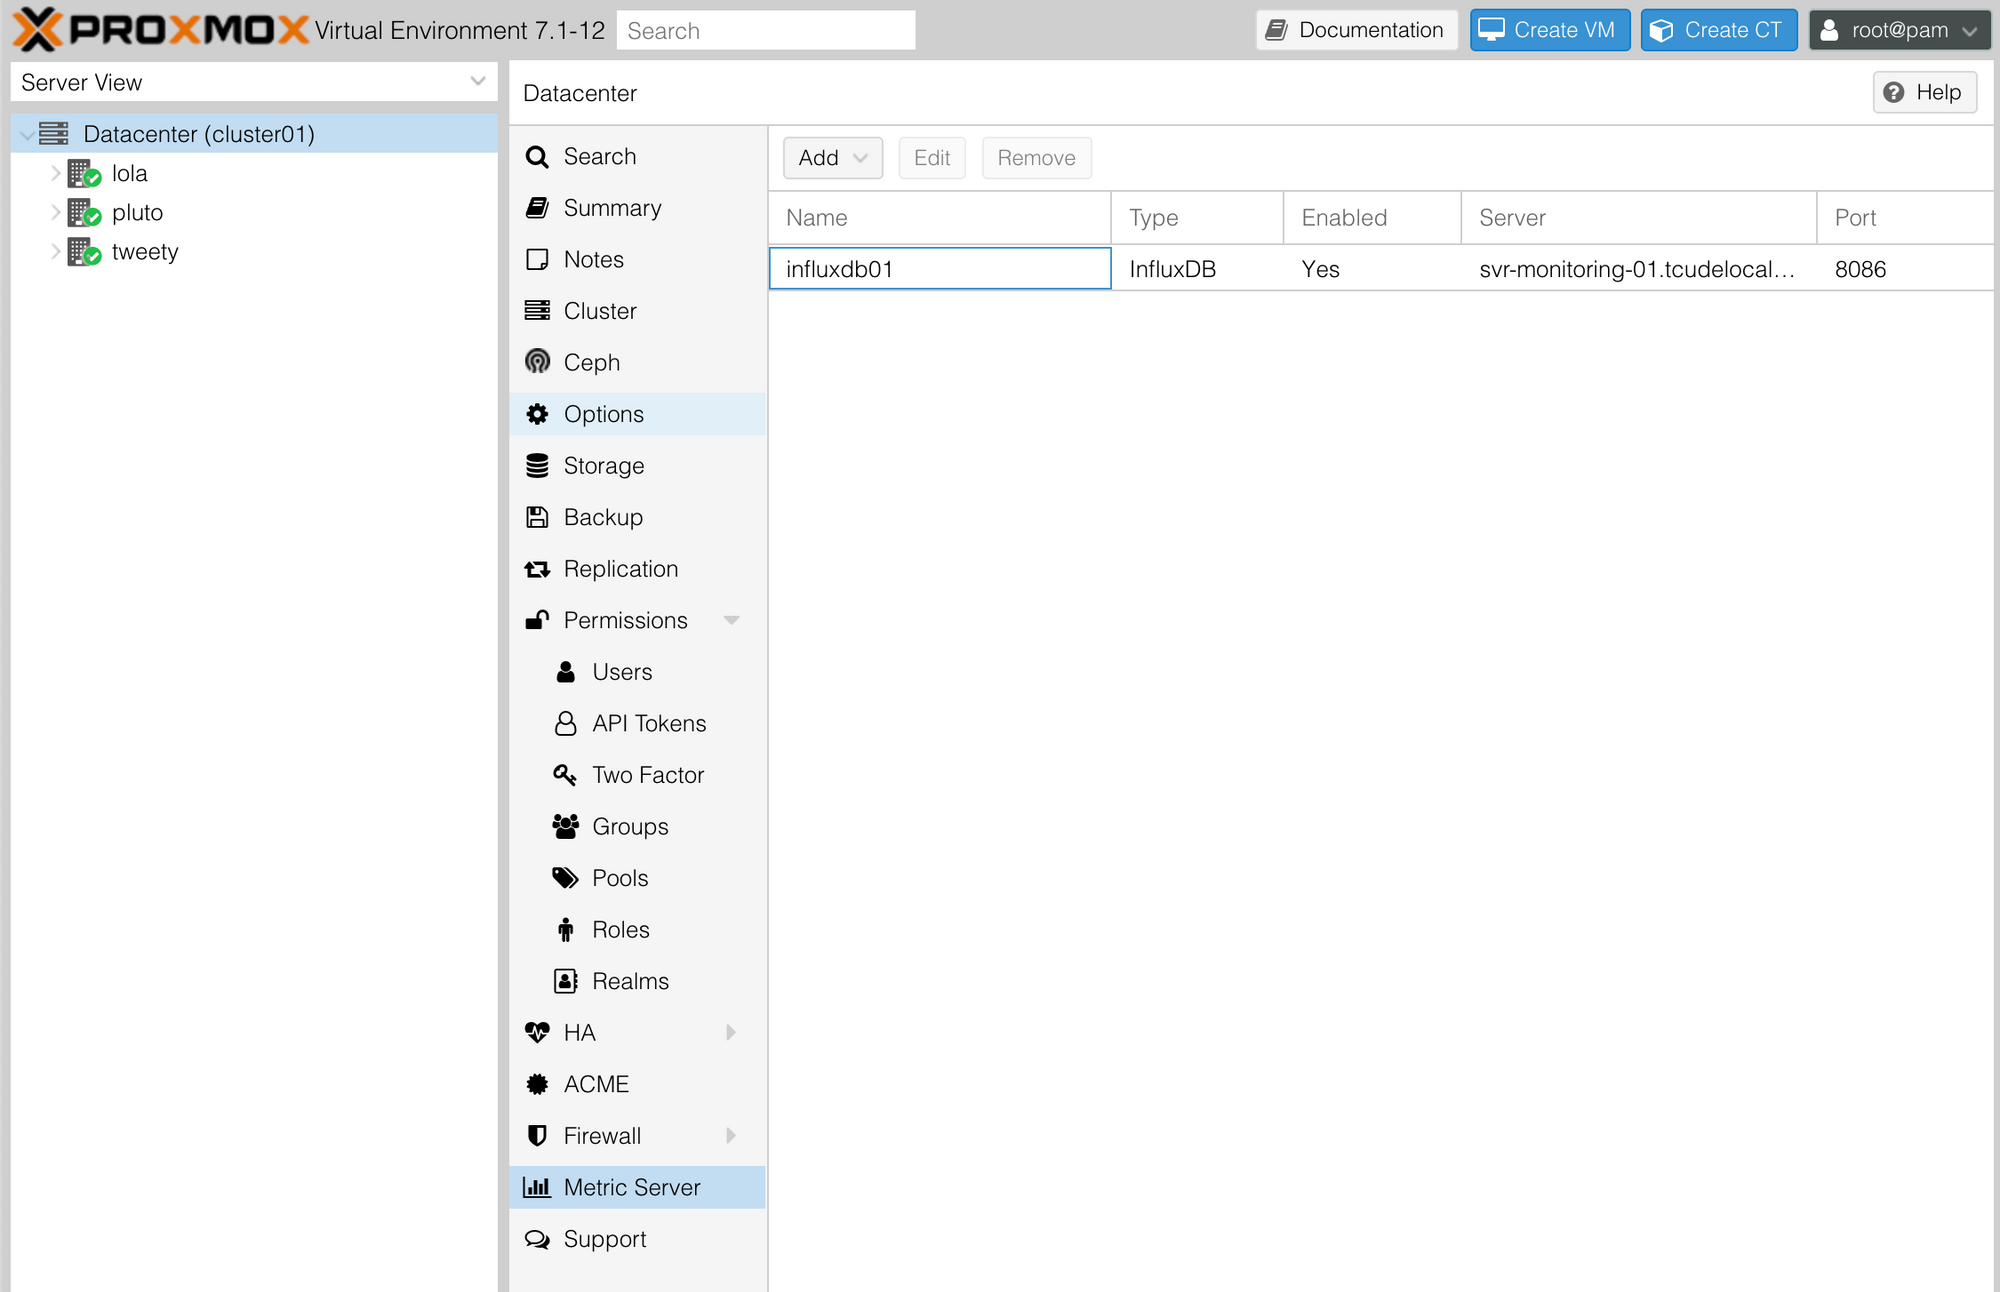
Clicking on the Datacenter tab on the left side, you will then have the option to visit the "Metric Server" section of the settings pane. Here, click on "Add" and then select "InfluxDB"
Here you will need to plug in all of the fields with their corresponding values that we have gathered previously.
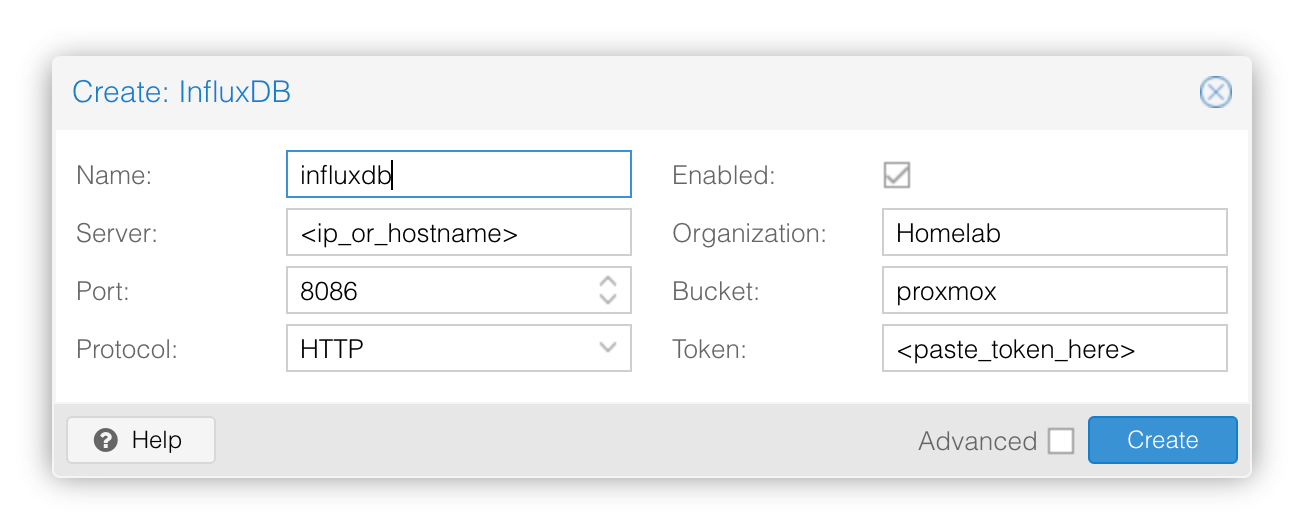
For Name, you can choose whatever name you would like. Server needs to be populated with either the IP or DNS name of the host running your InfluxDB server. Port should correspond with the port of the InfluxDB container you created in the earlier step and should be 8086. Protocol will need to be switched from UDP to HTTP, unless you're utilizing SSL, in which case it would need to be HTTPS.
As for Organization and Bucket, these are simply the values you had defined when creating the InfluxDB instance.
Lastly, for the Token, simply paste your user's token from InfluxDB into this field.
Confirming Data is Flowing
Before we move on, let's go back into InfluxDB and ensure data is flowing into it from Proxmox.
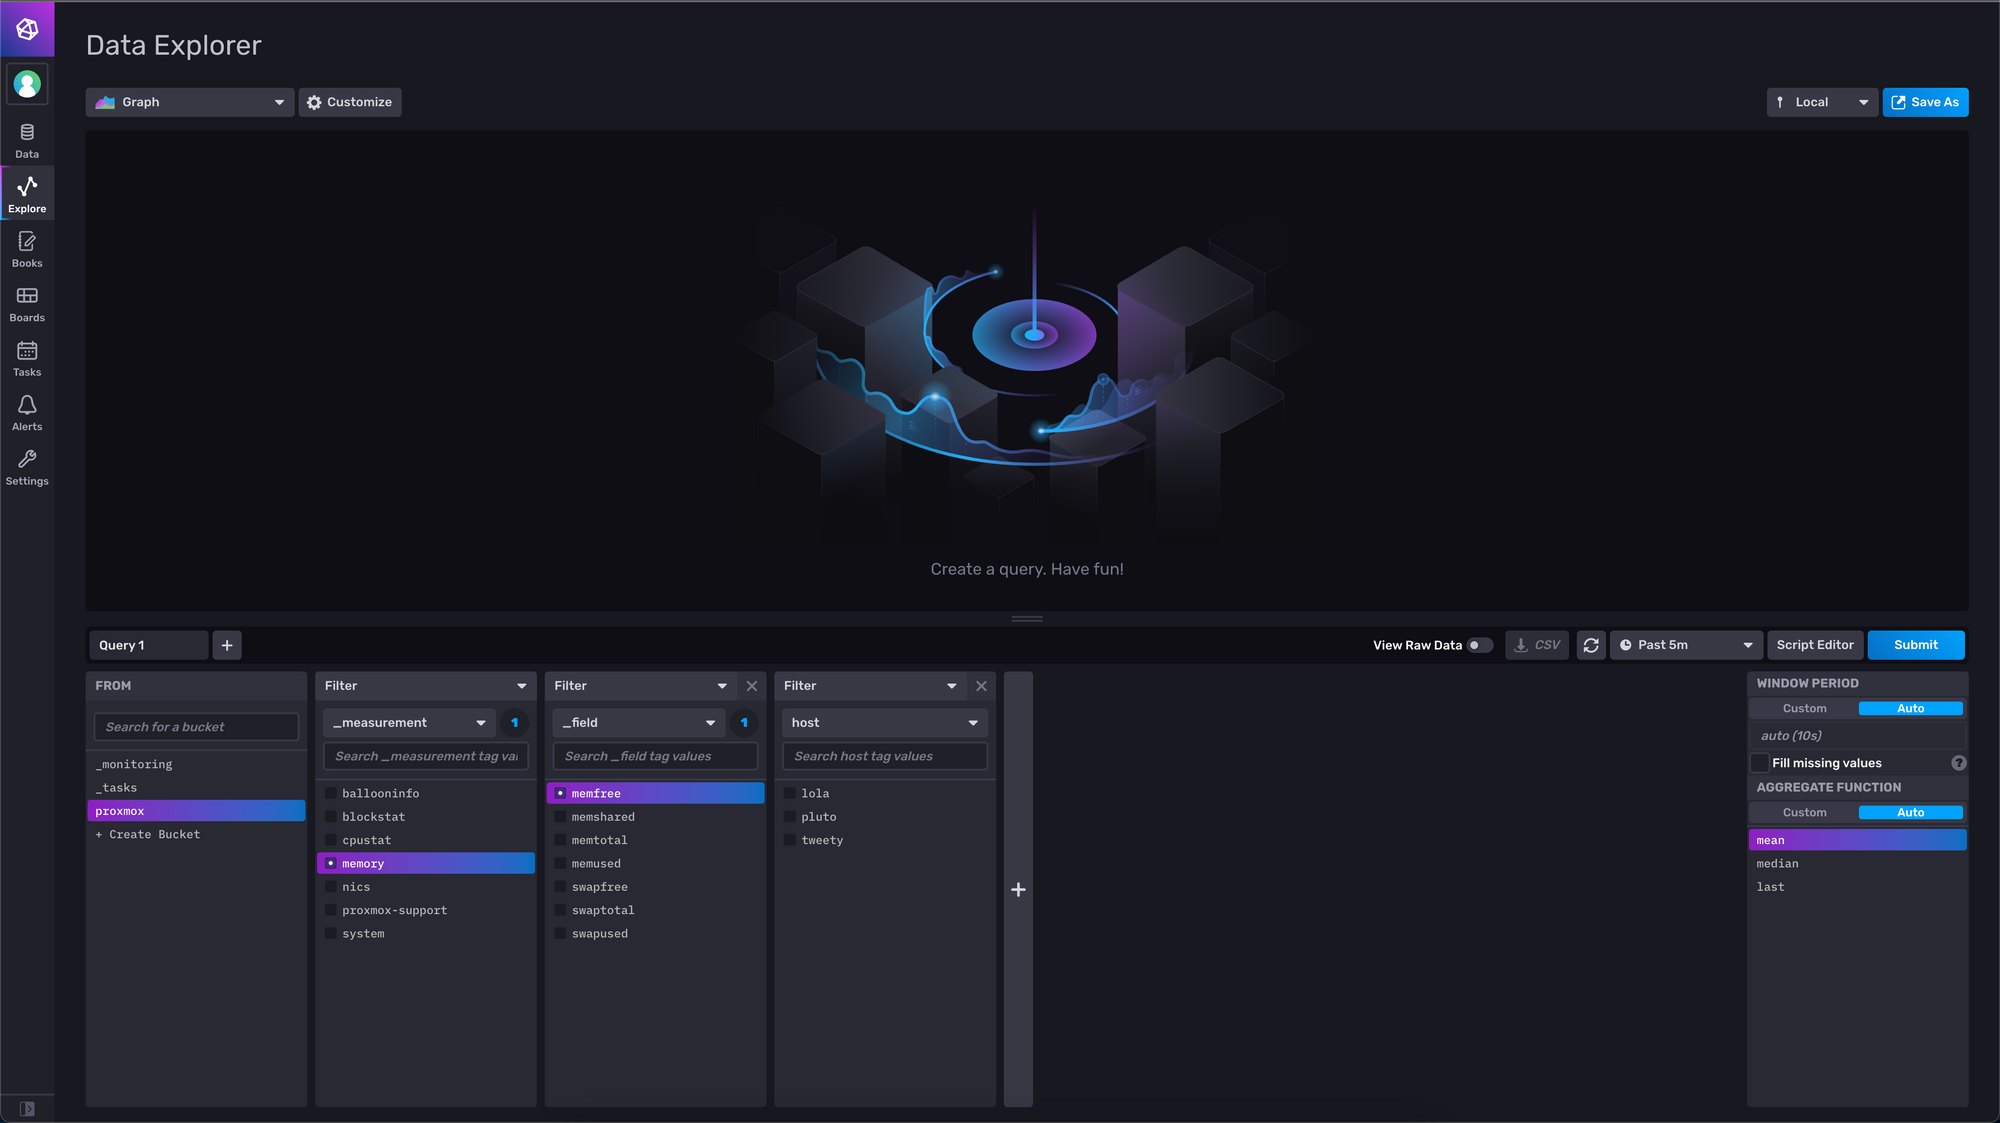
To ensure your data is flowing properly, click on the "Explore" tab on the left side and explore the various options within your proxmox bucket. If they look similar to what is displayed above, you should be good to go. If you are not seeing data similar to what is shown above, revisit the previous step and ensure your values are correct.
Configuring Grafana
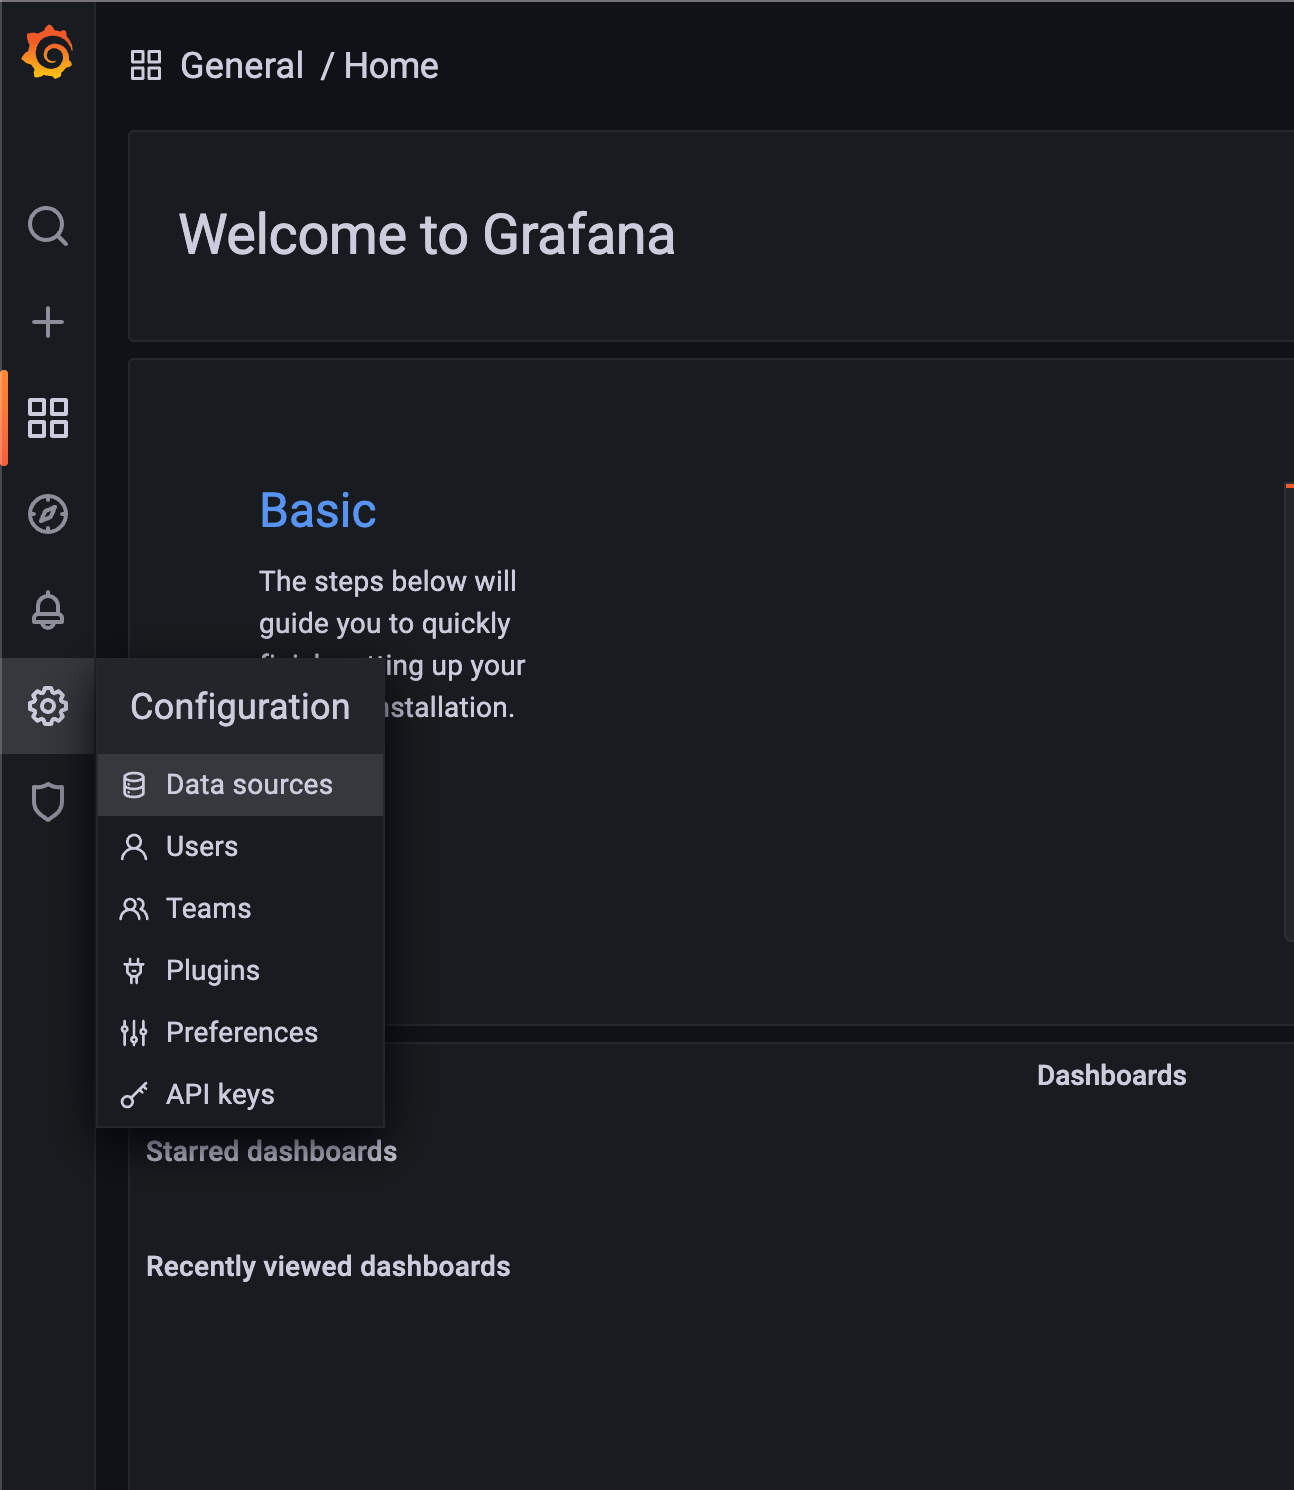
Now it is time to visit Grafana on <hostname>:3000. After logging in with the default credentials of admin/admin and choosing a new password, navigate to the "Configuration" tab, shown above, and select "Data sources"
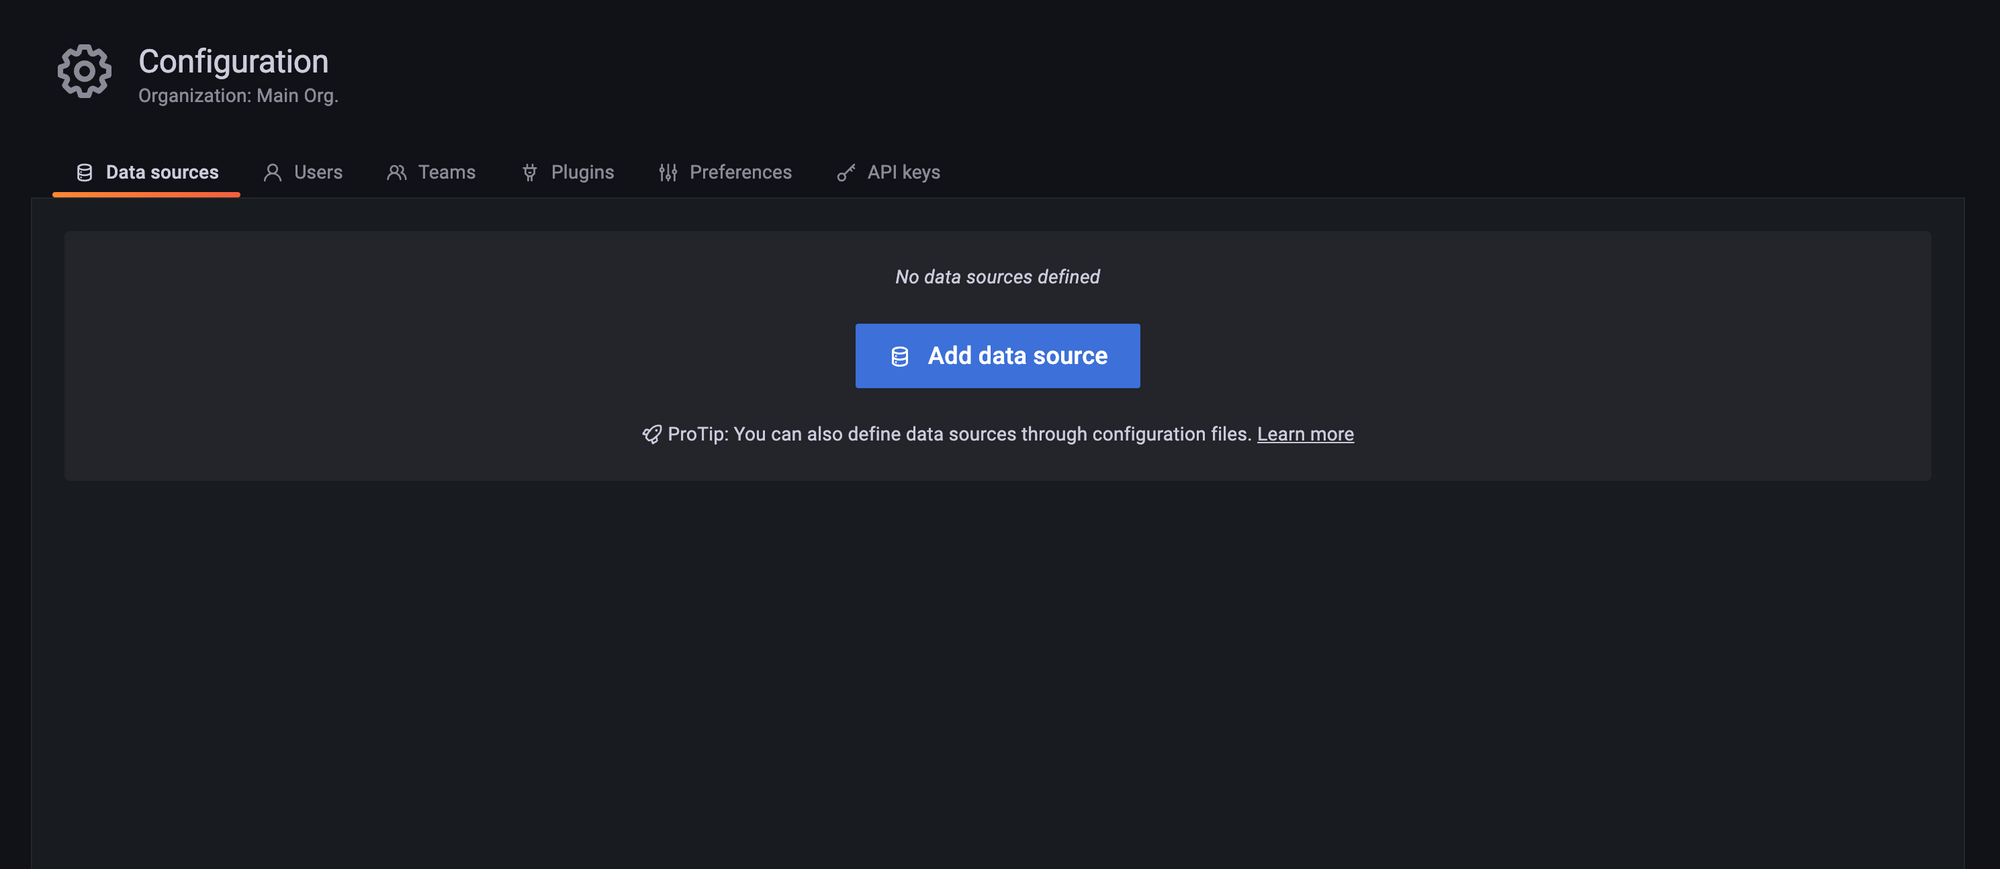
Select "Add data source"
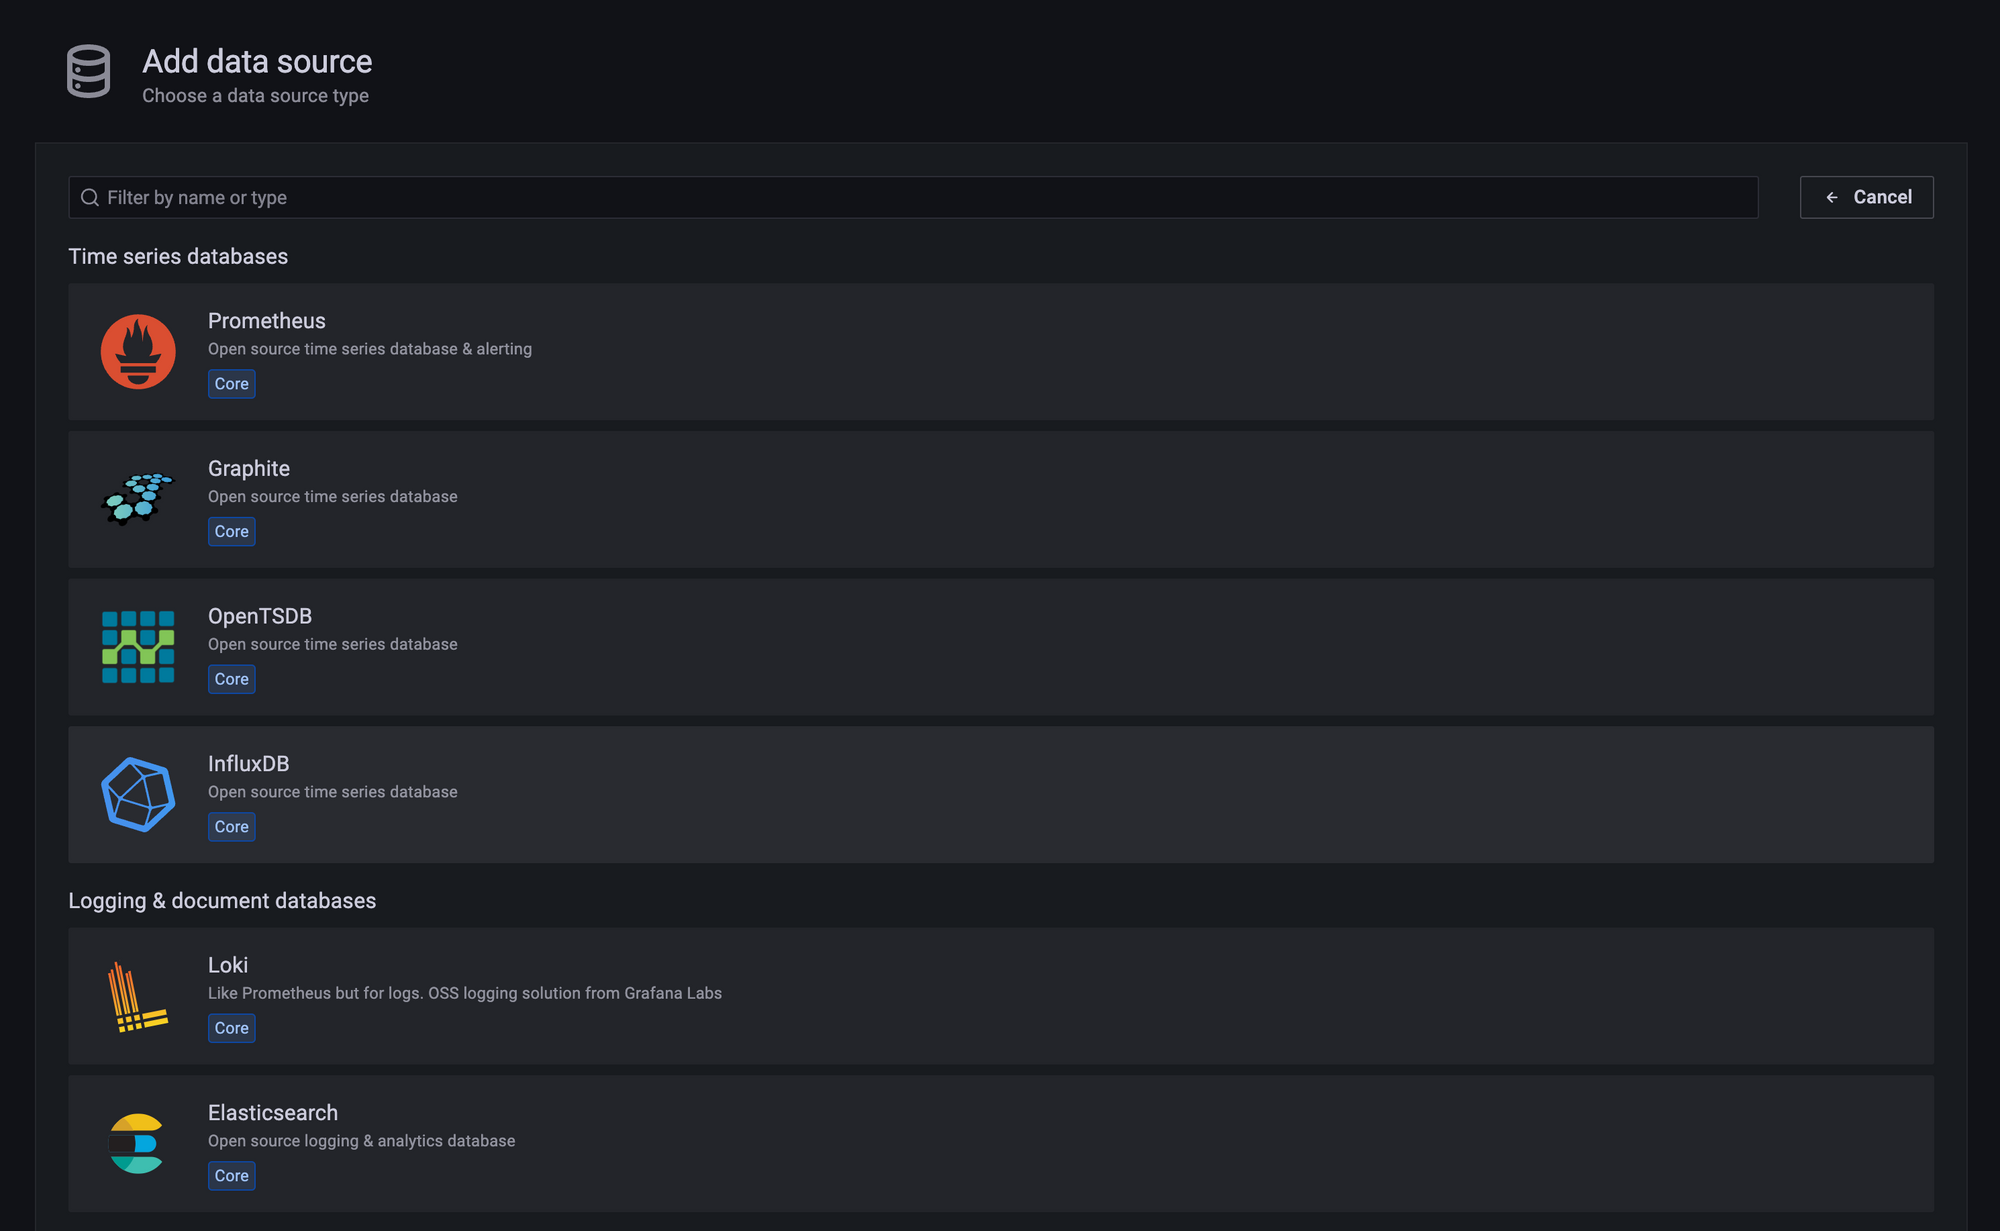
Select InfluxDB from the provided list
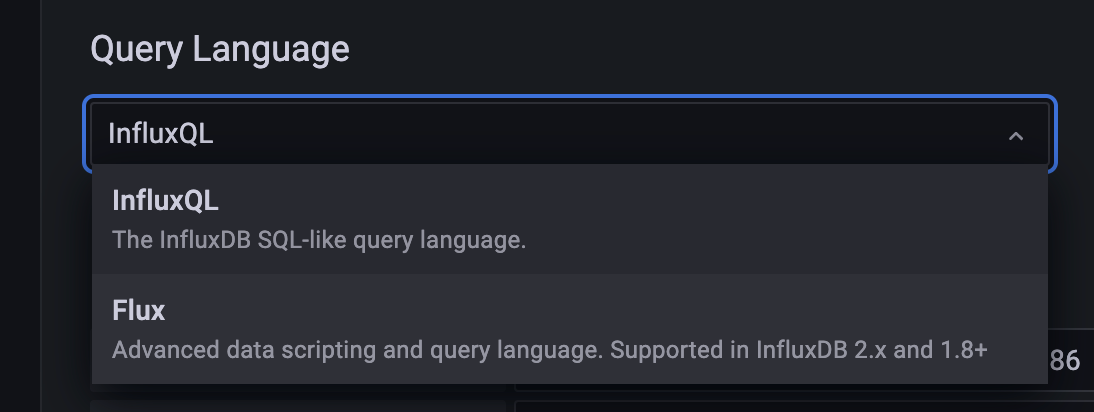
Upon being taken to the configuration page for InfluxDB, the first thing you will need to do is change the query language from "InfluxQL" to "Flux". "Flux" is the new language being used by InfluxDB and, while still in beta, has been entirely stable for me.
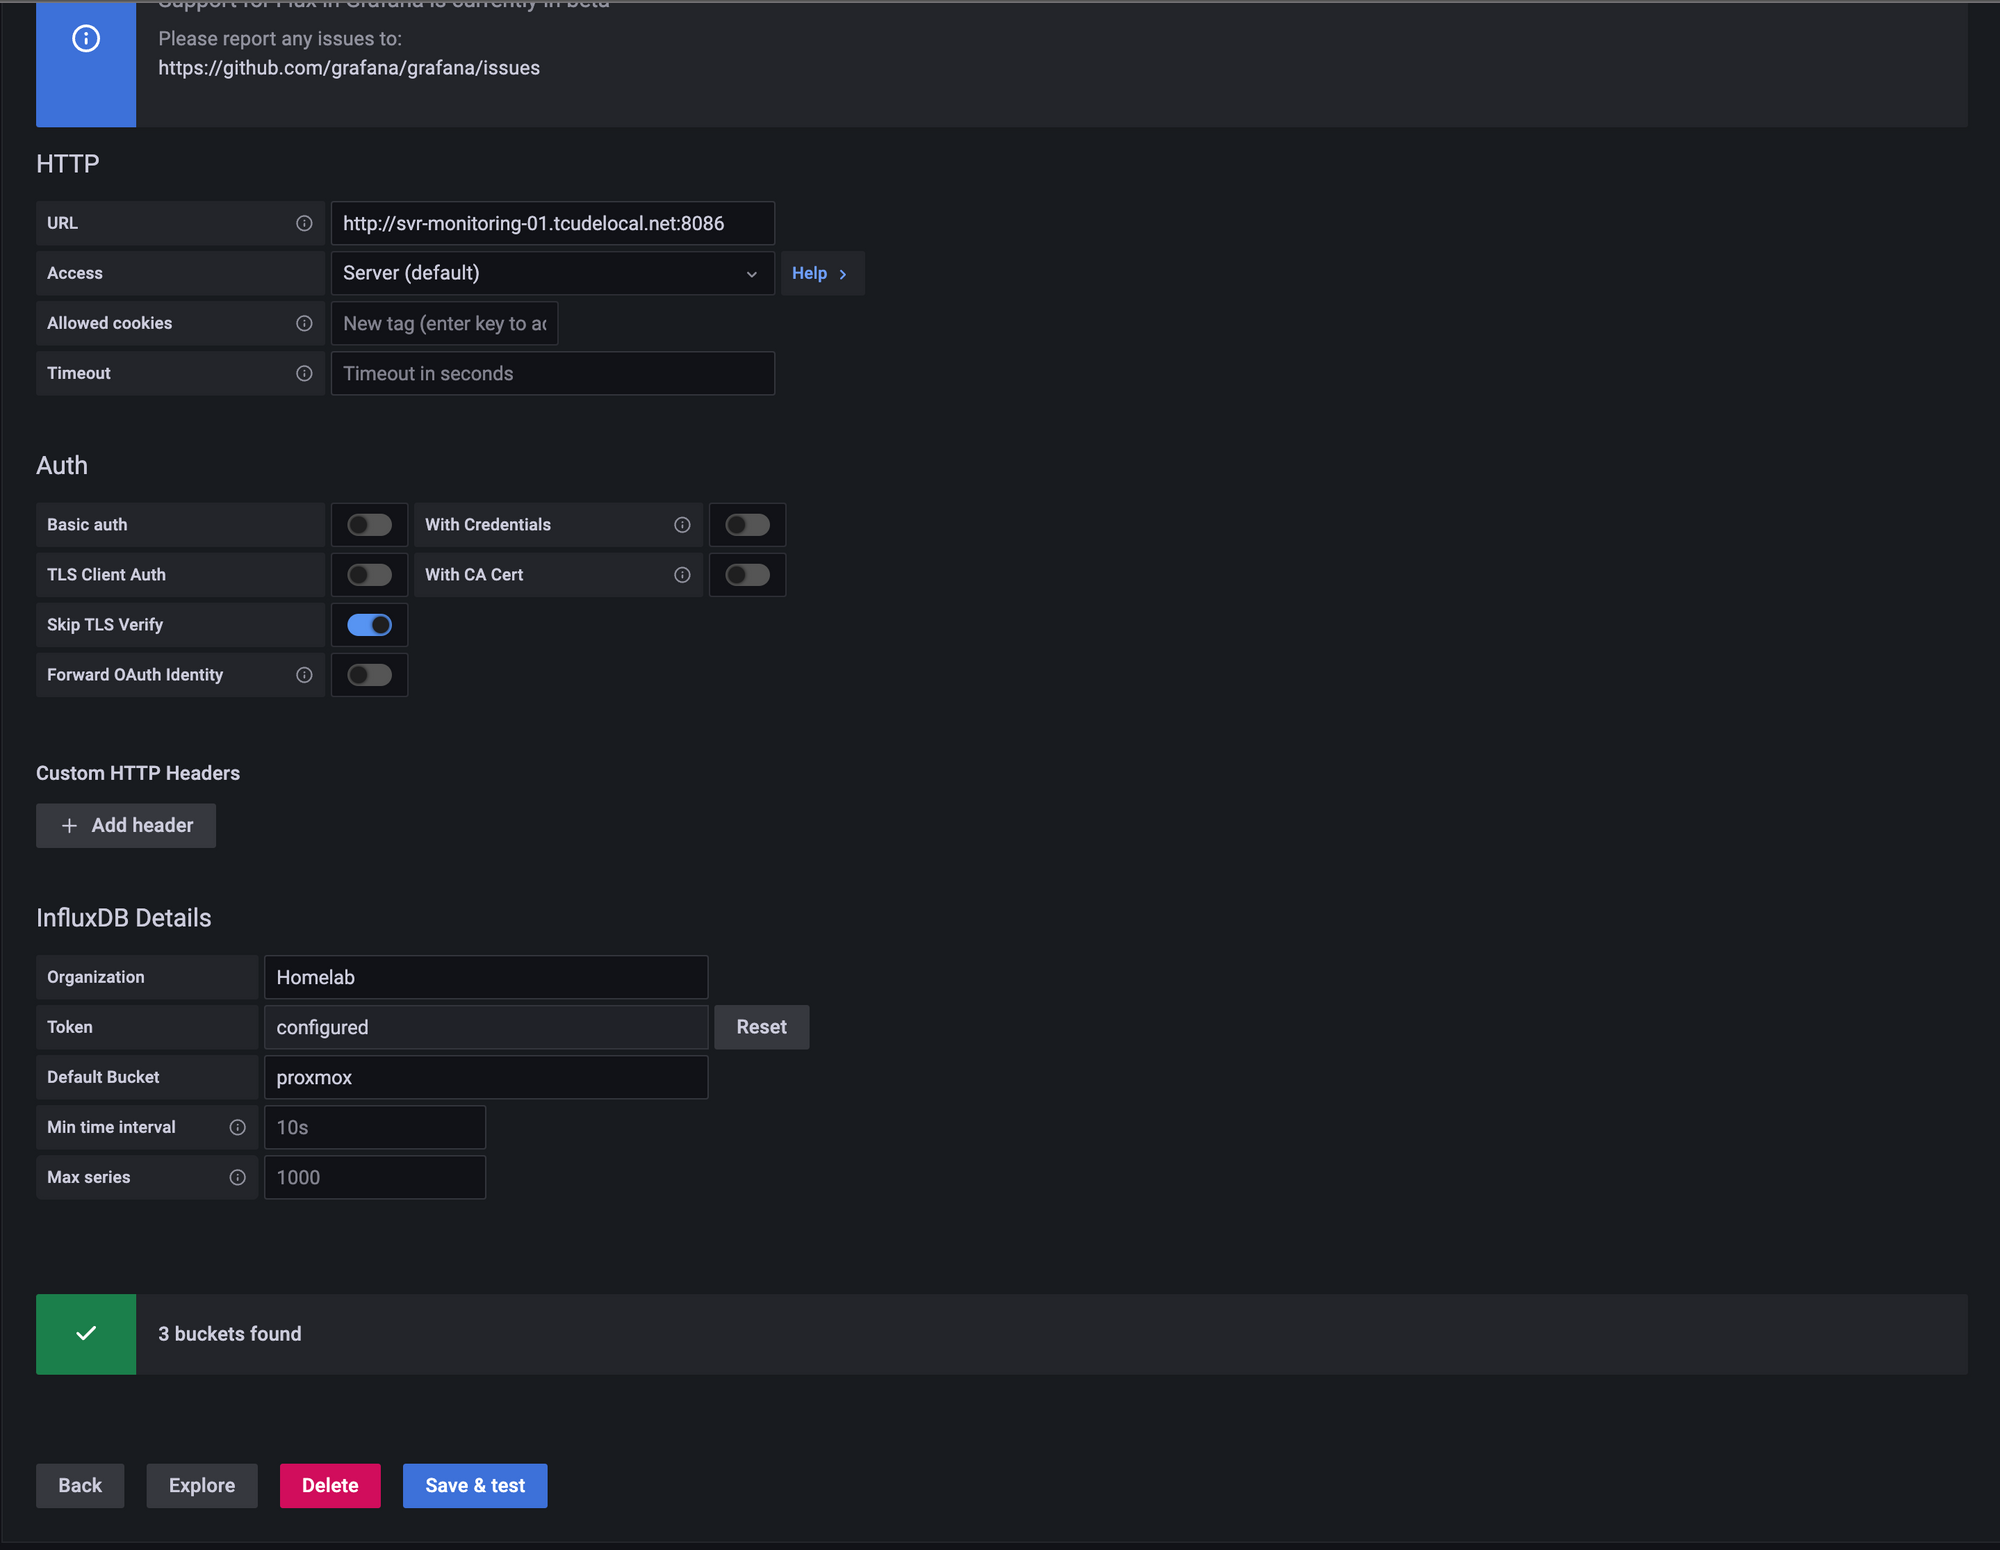
Next comes the rest of the InfluxDB configuration. To start, provide the hostname or IP and port of InfluxDB in the "URL" field, disable "Basic auth", enable "Skip TLS Verify", and finally, populate the "InfluxDB Details" with the same data that you used previously to set up InfluxDB on Proxmox.
Once done, select "Save & test". If everything was plugged in correctly, you will be provided with a green checkmark and a message indicating how many buckets Grafana found within your InfluxDB instance.
Querying and Visualizing Data in Grafana
Now that Proxmox is feeding into InfluxDB and InfluxDB is linked up with Grafana, we are ready to start querying data from the database and visualizing it with Grafana!
With us having chosen to use the Flux language, you will want to use this dashboard that someone has already made in order to visualize your data.
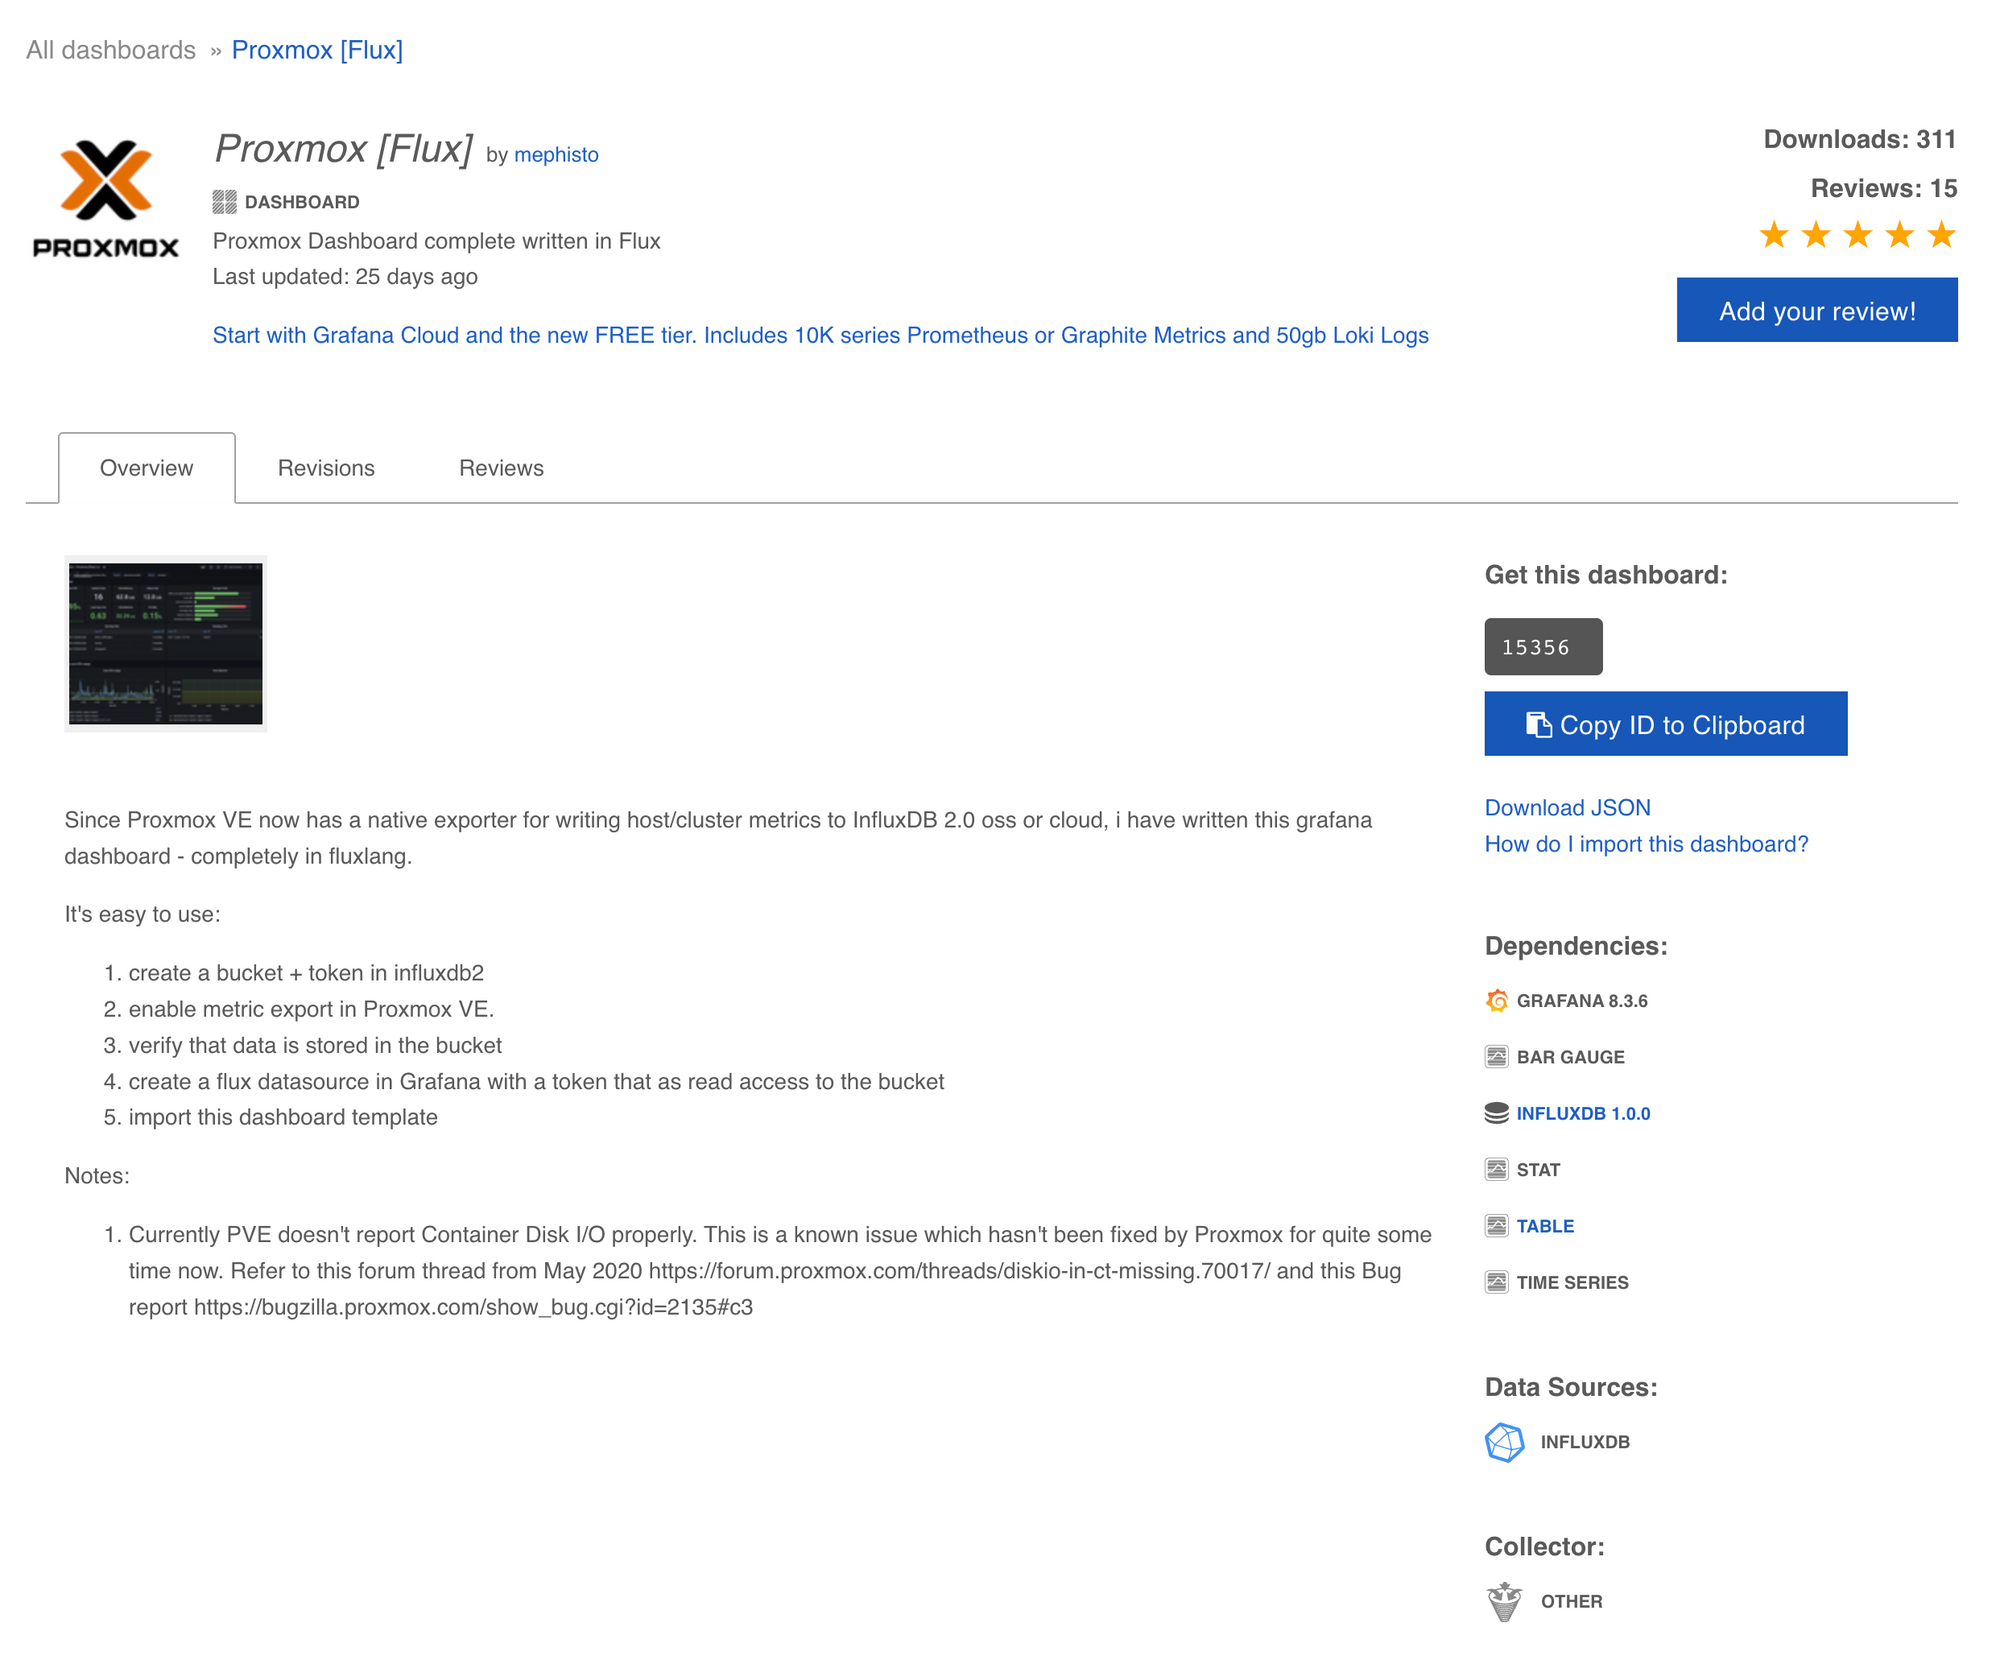
On the site for this pre-made page, simply click to copy the ID for the dashboard
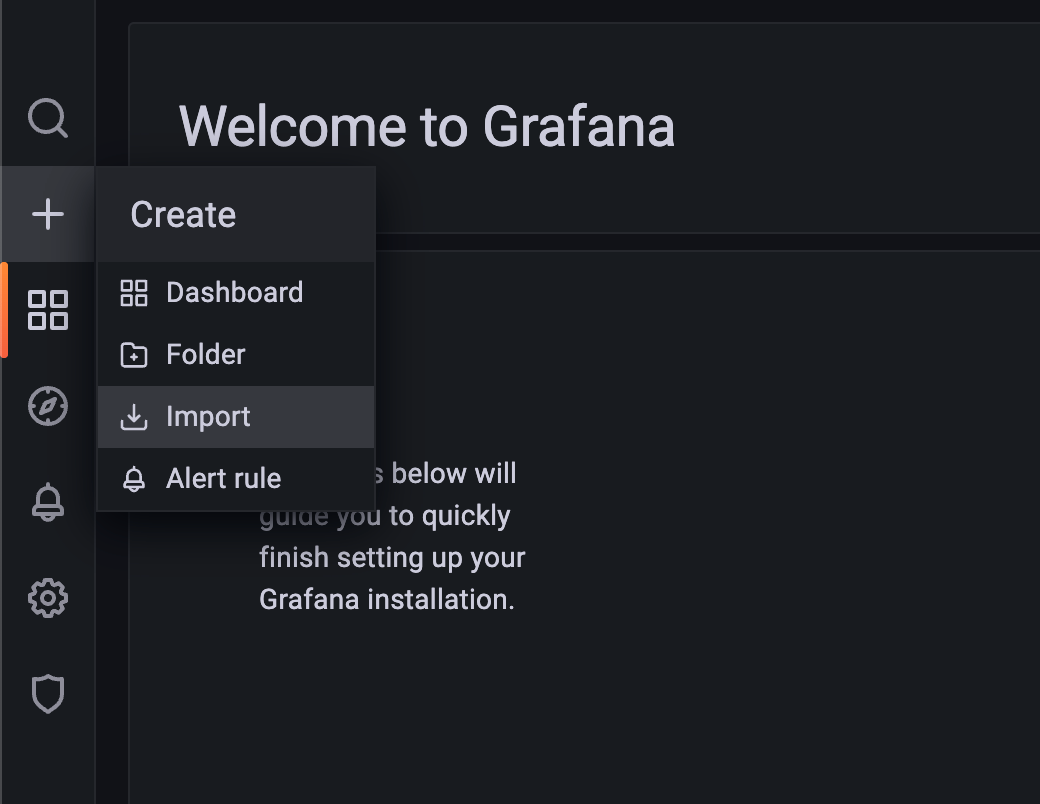
Next, within Grafana, hover over the plus icon and select "Import", as shown above
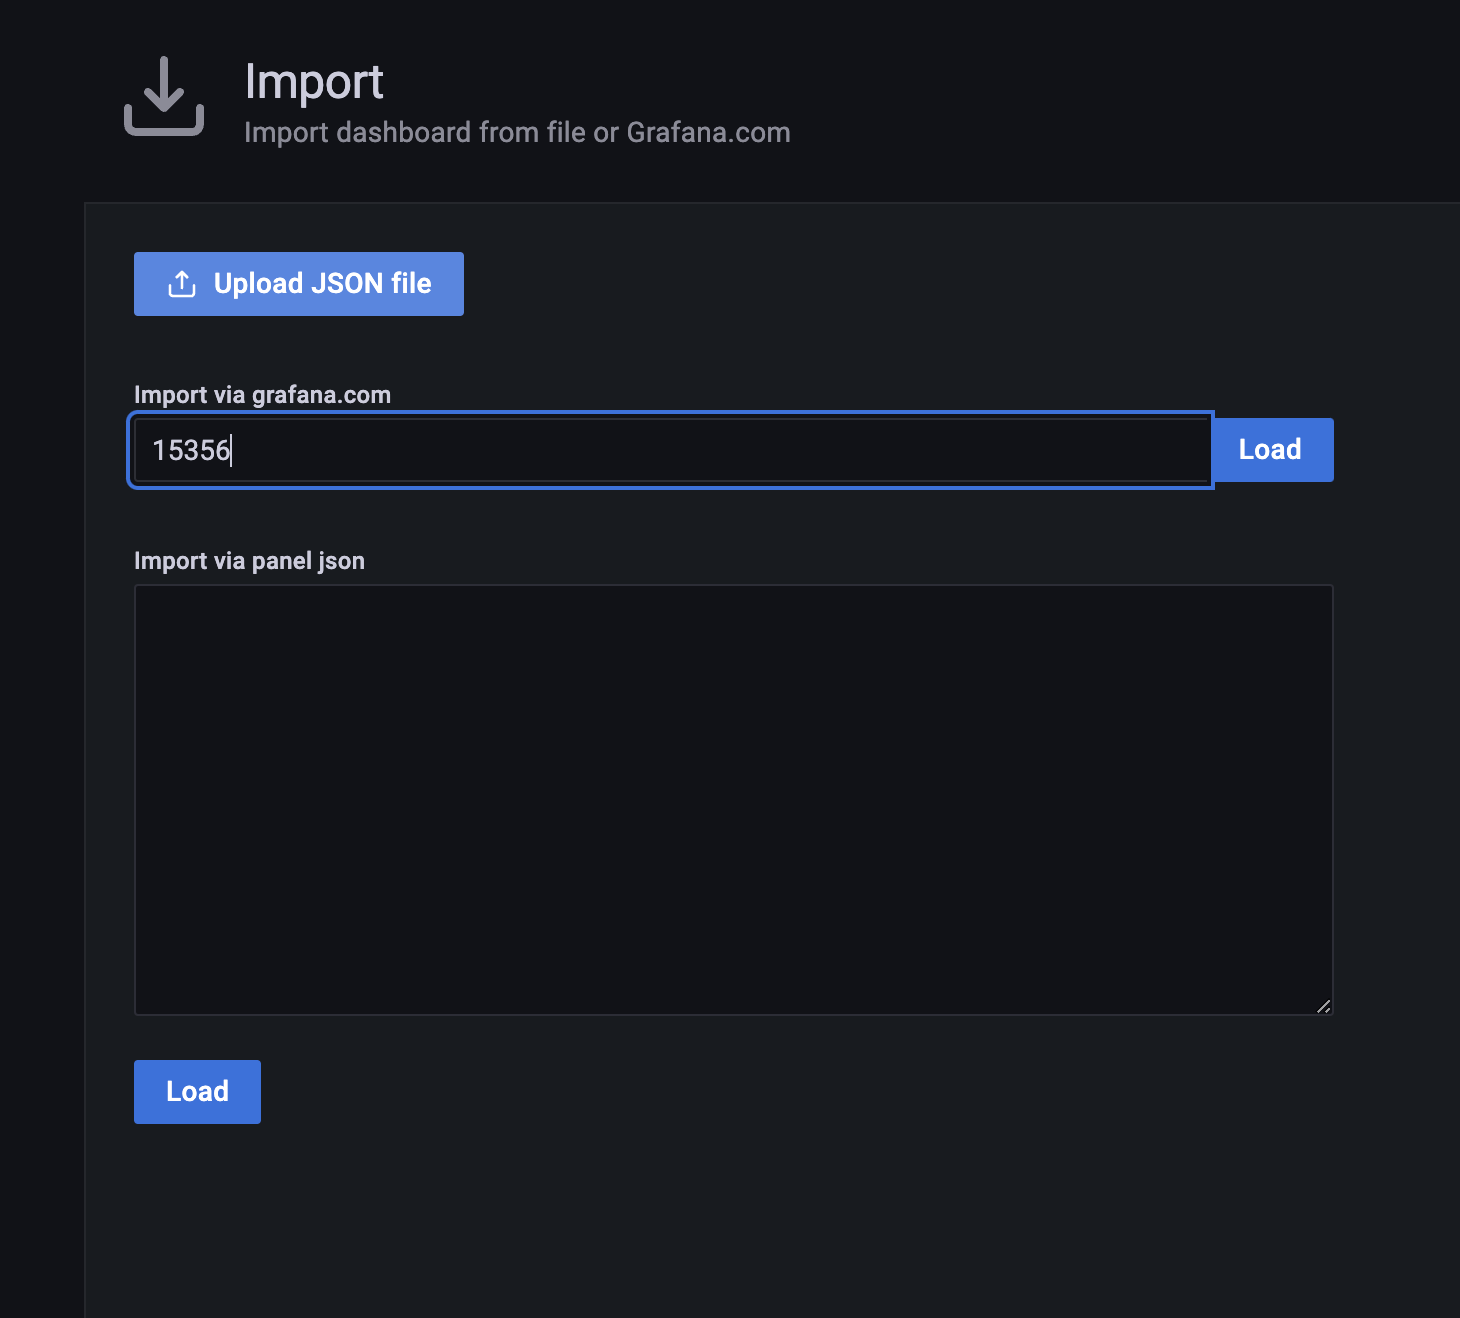
Paste in the ID you copied previously and select "Load" next to the field you pasted in
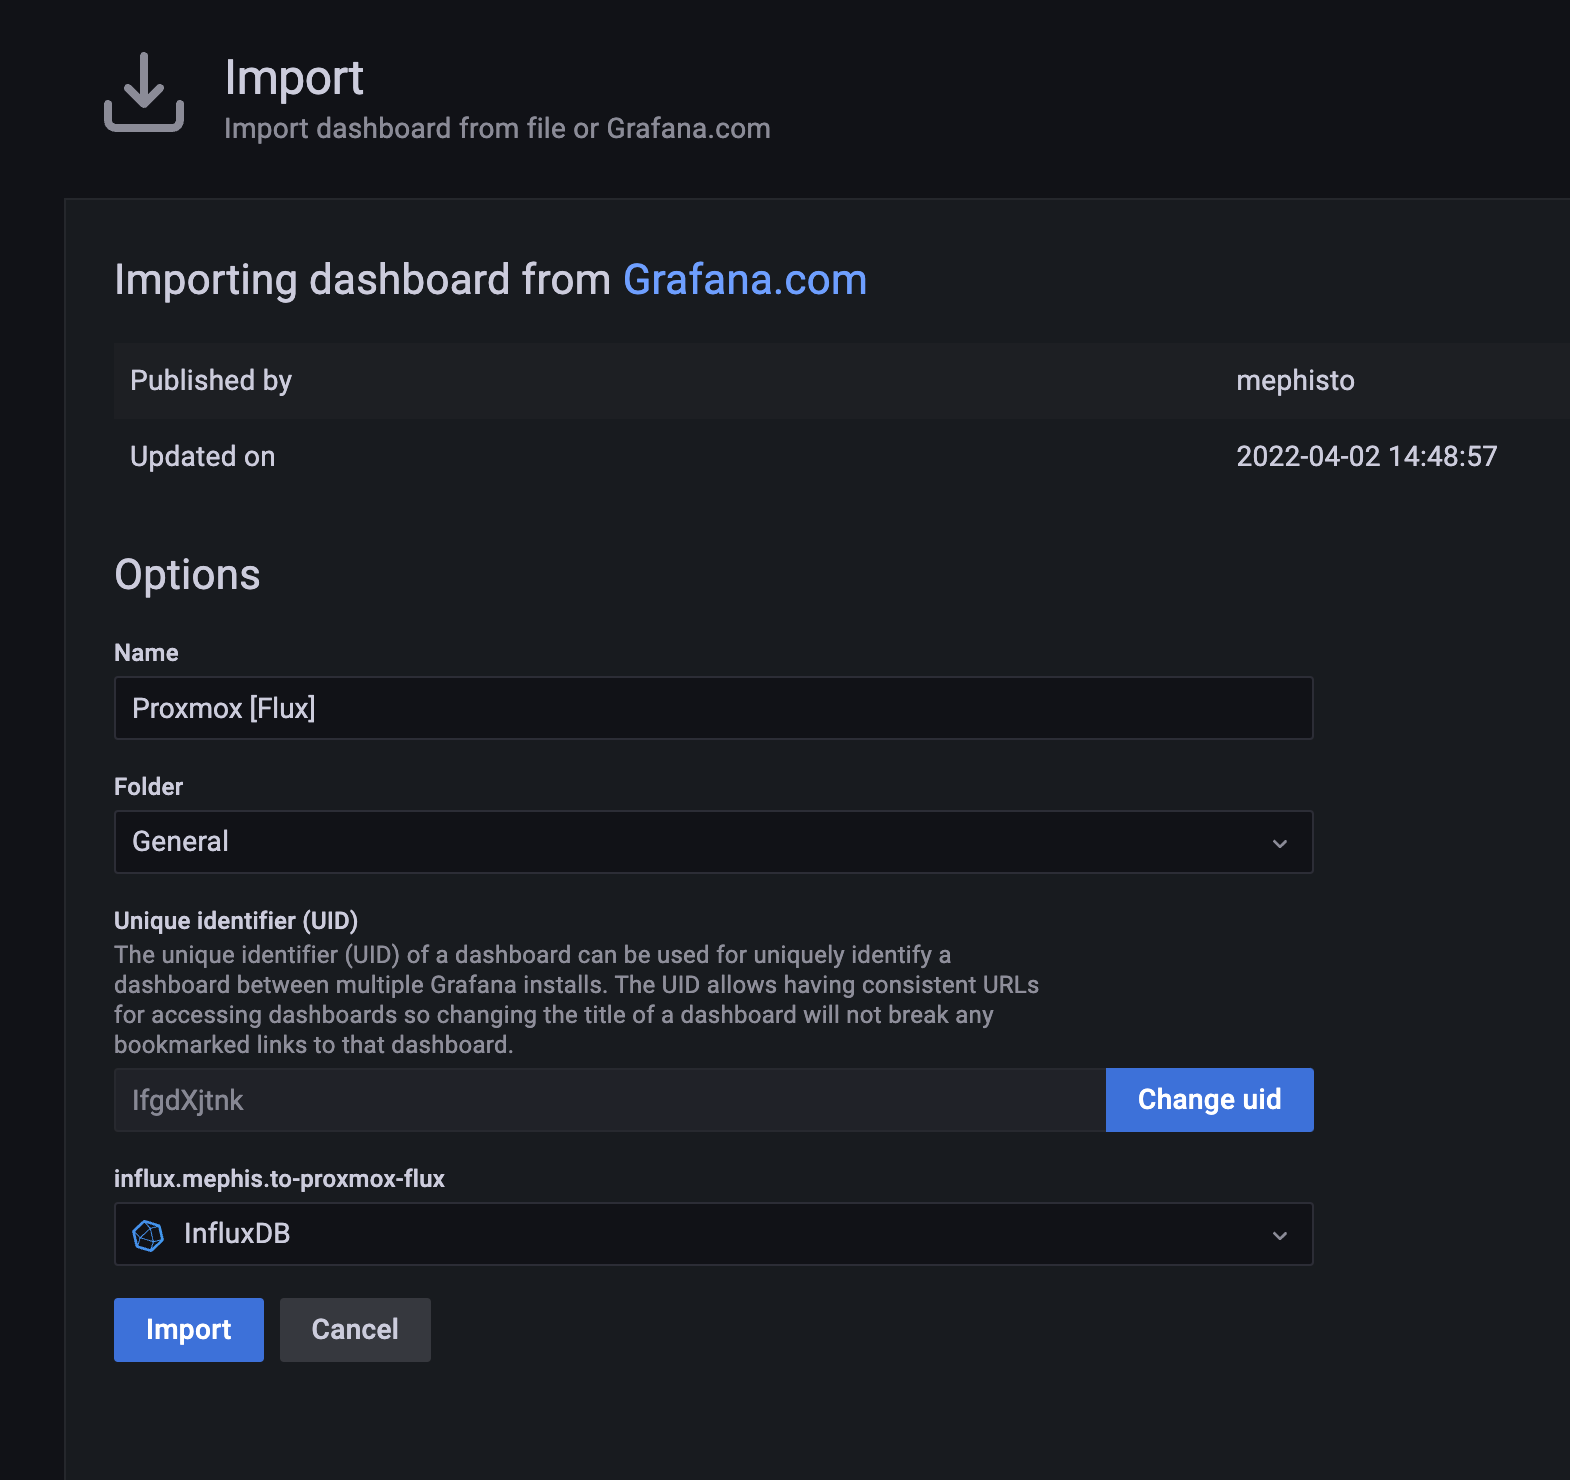
Lastly, you are able to configure a few settings for this dashboard. Make sure to set the dropdown menu at the bottom to utilize your InfluxDB instance. Other than that, I have chosen to leave the remaining values as their defaults.
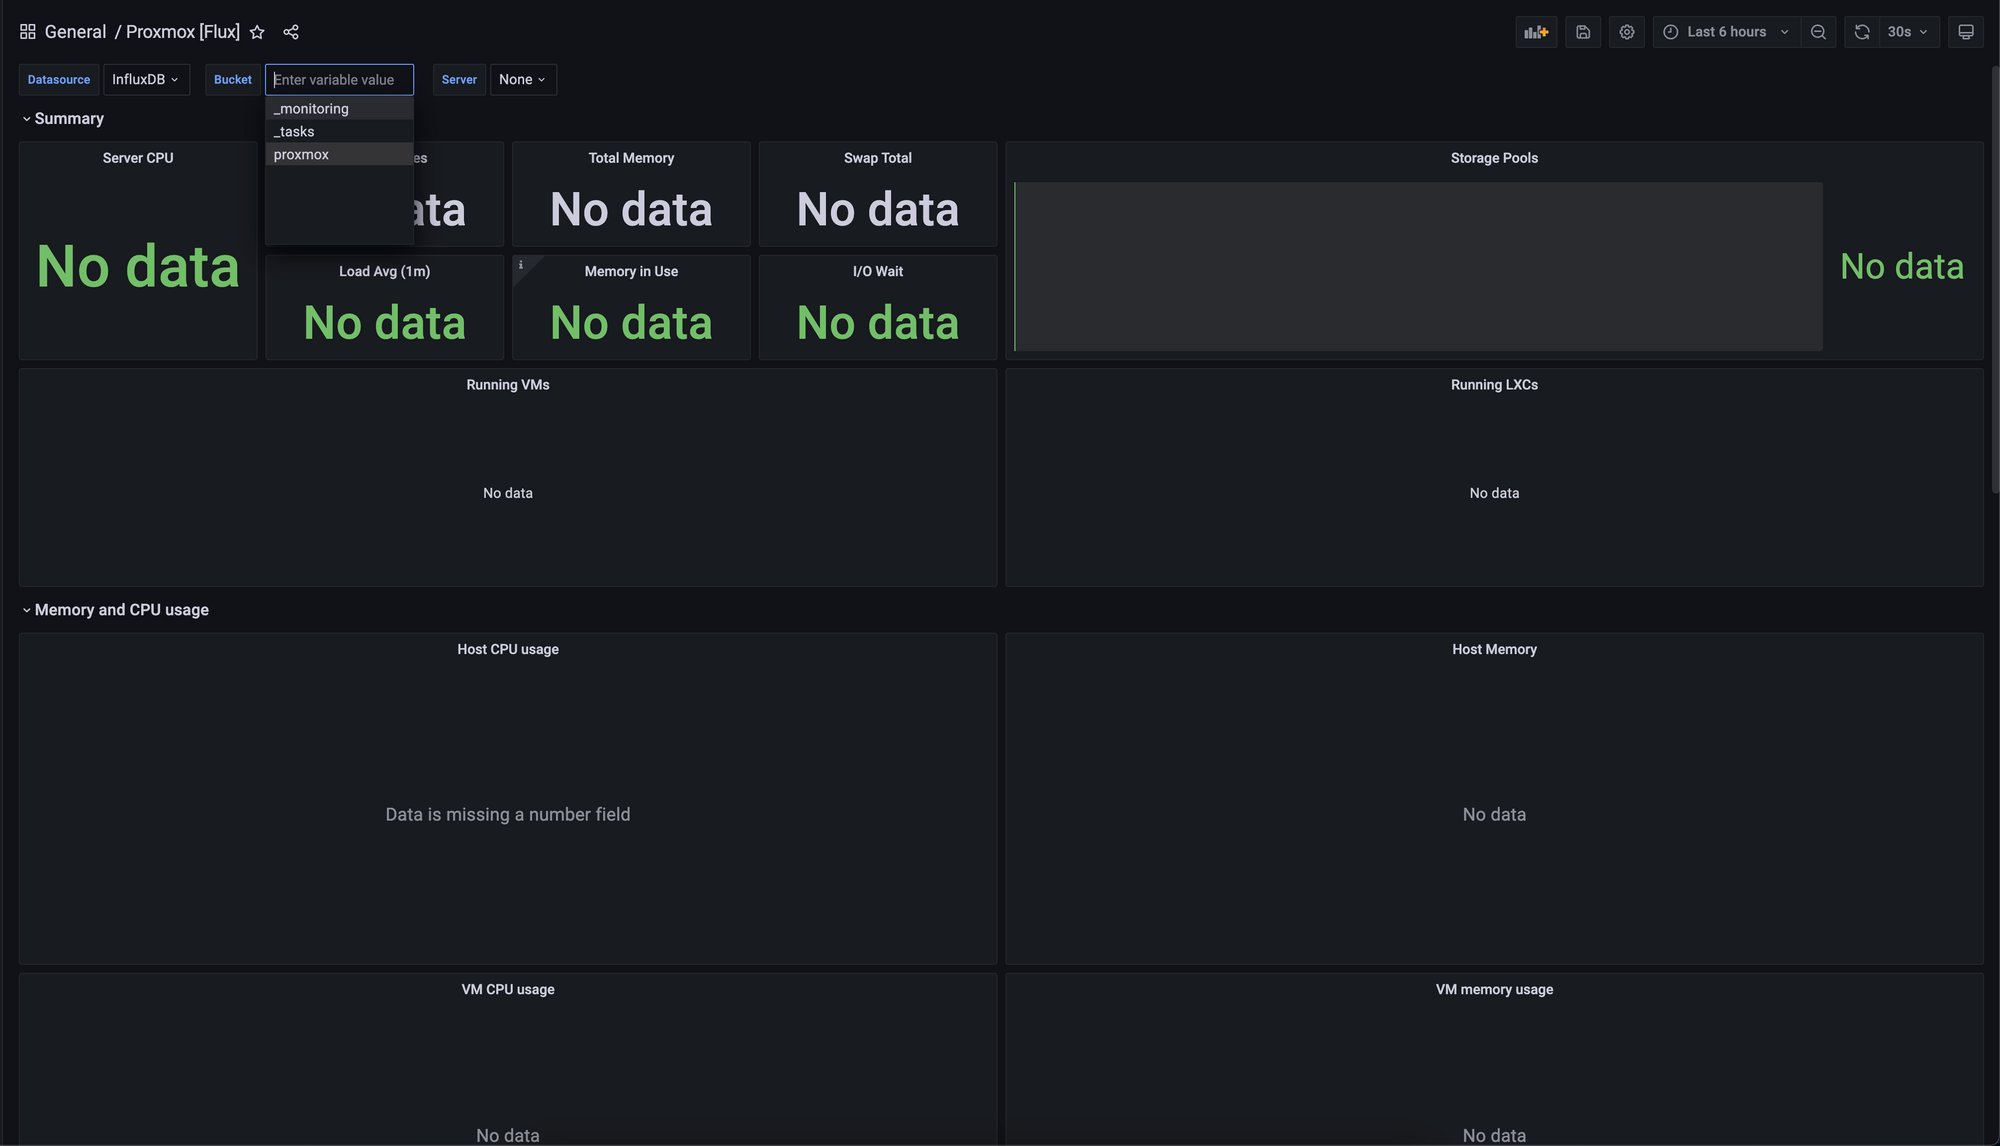
The very last step in order to get your dashboard up and running is to now select the bucket type, as shown above. Ensure that your proxmox bucket from InfluxDB is chosen.
Conclusion
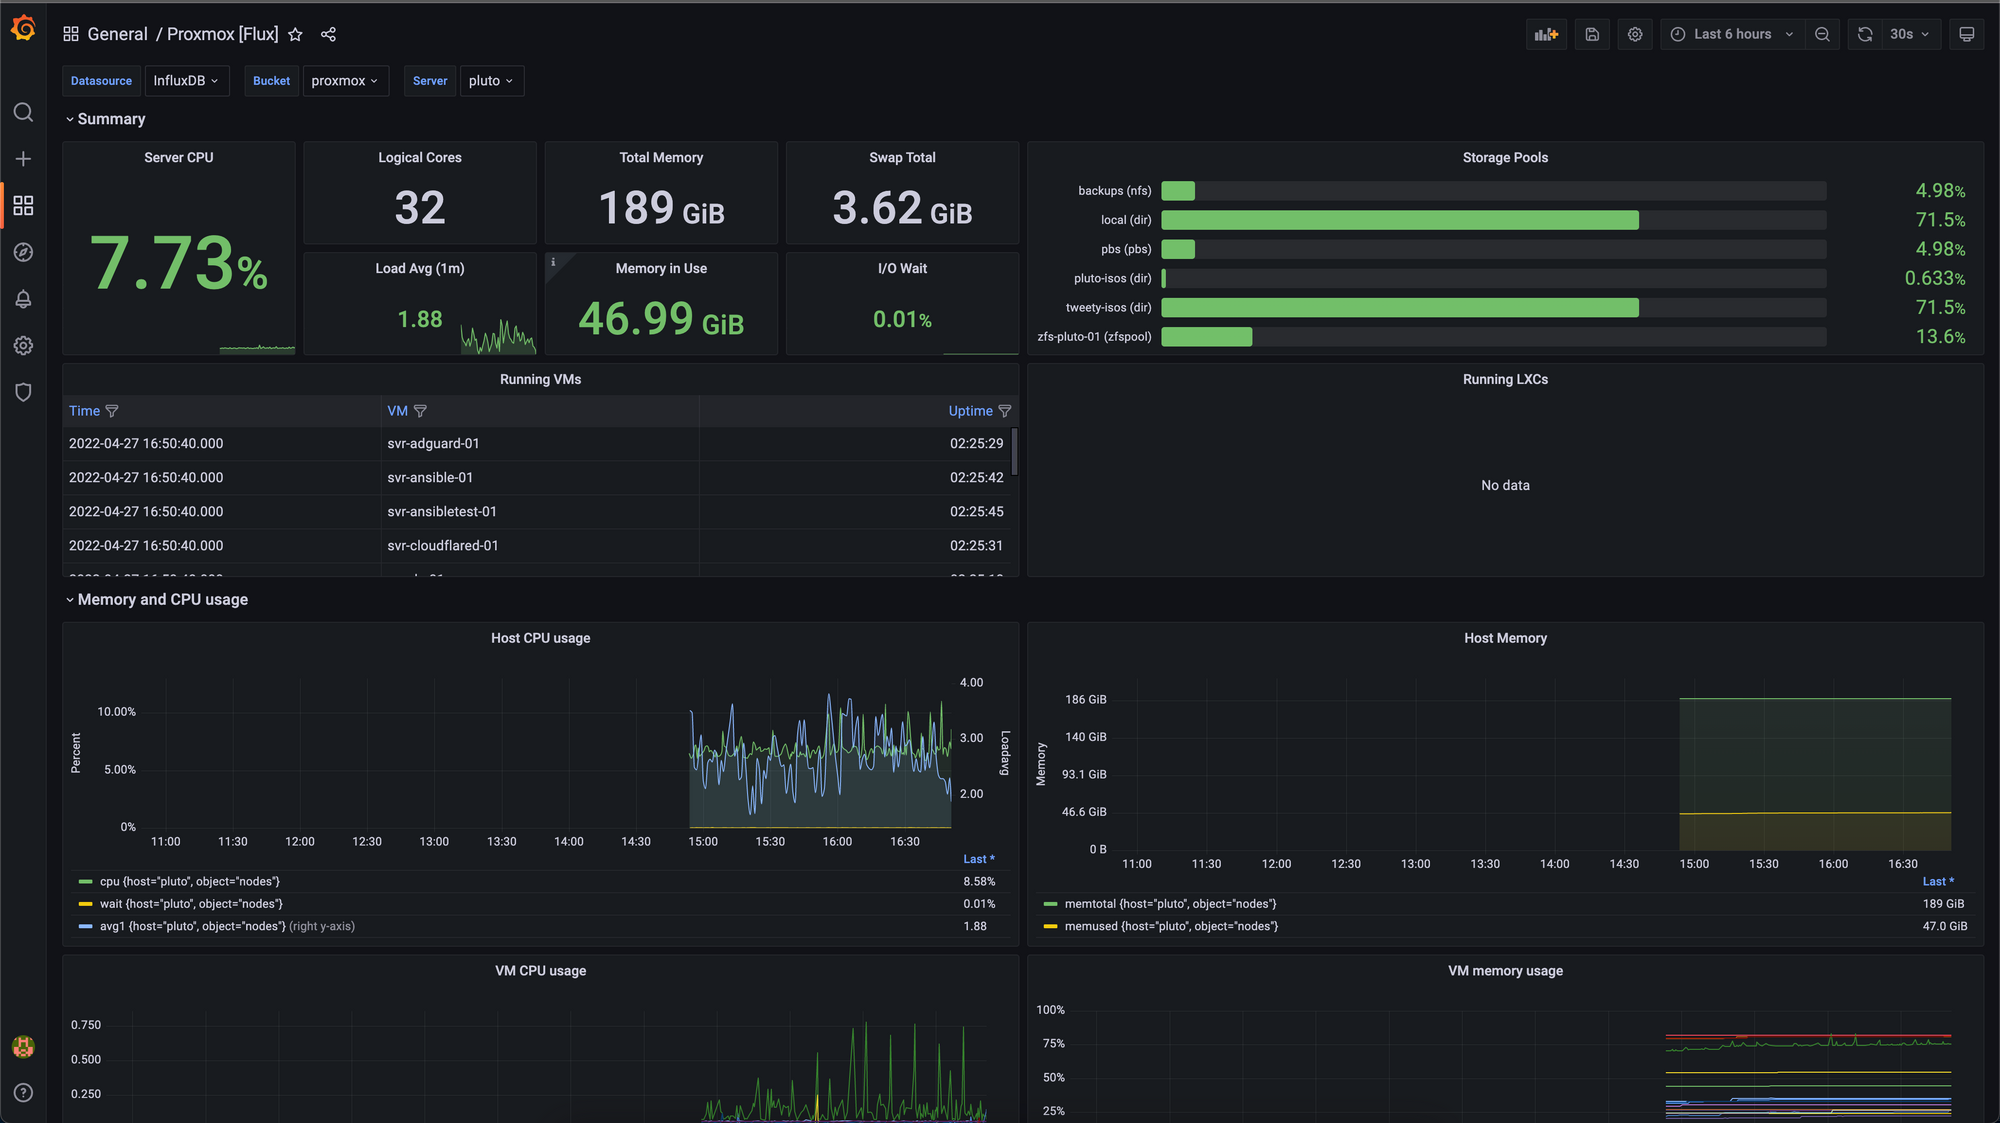
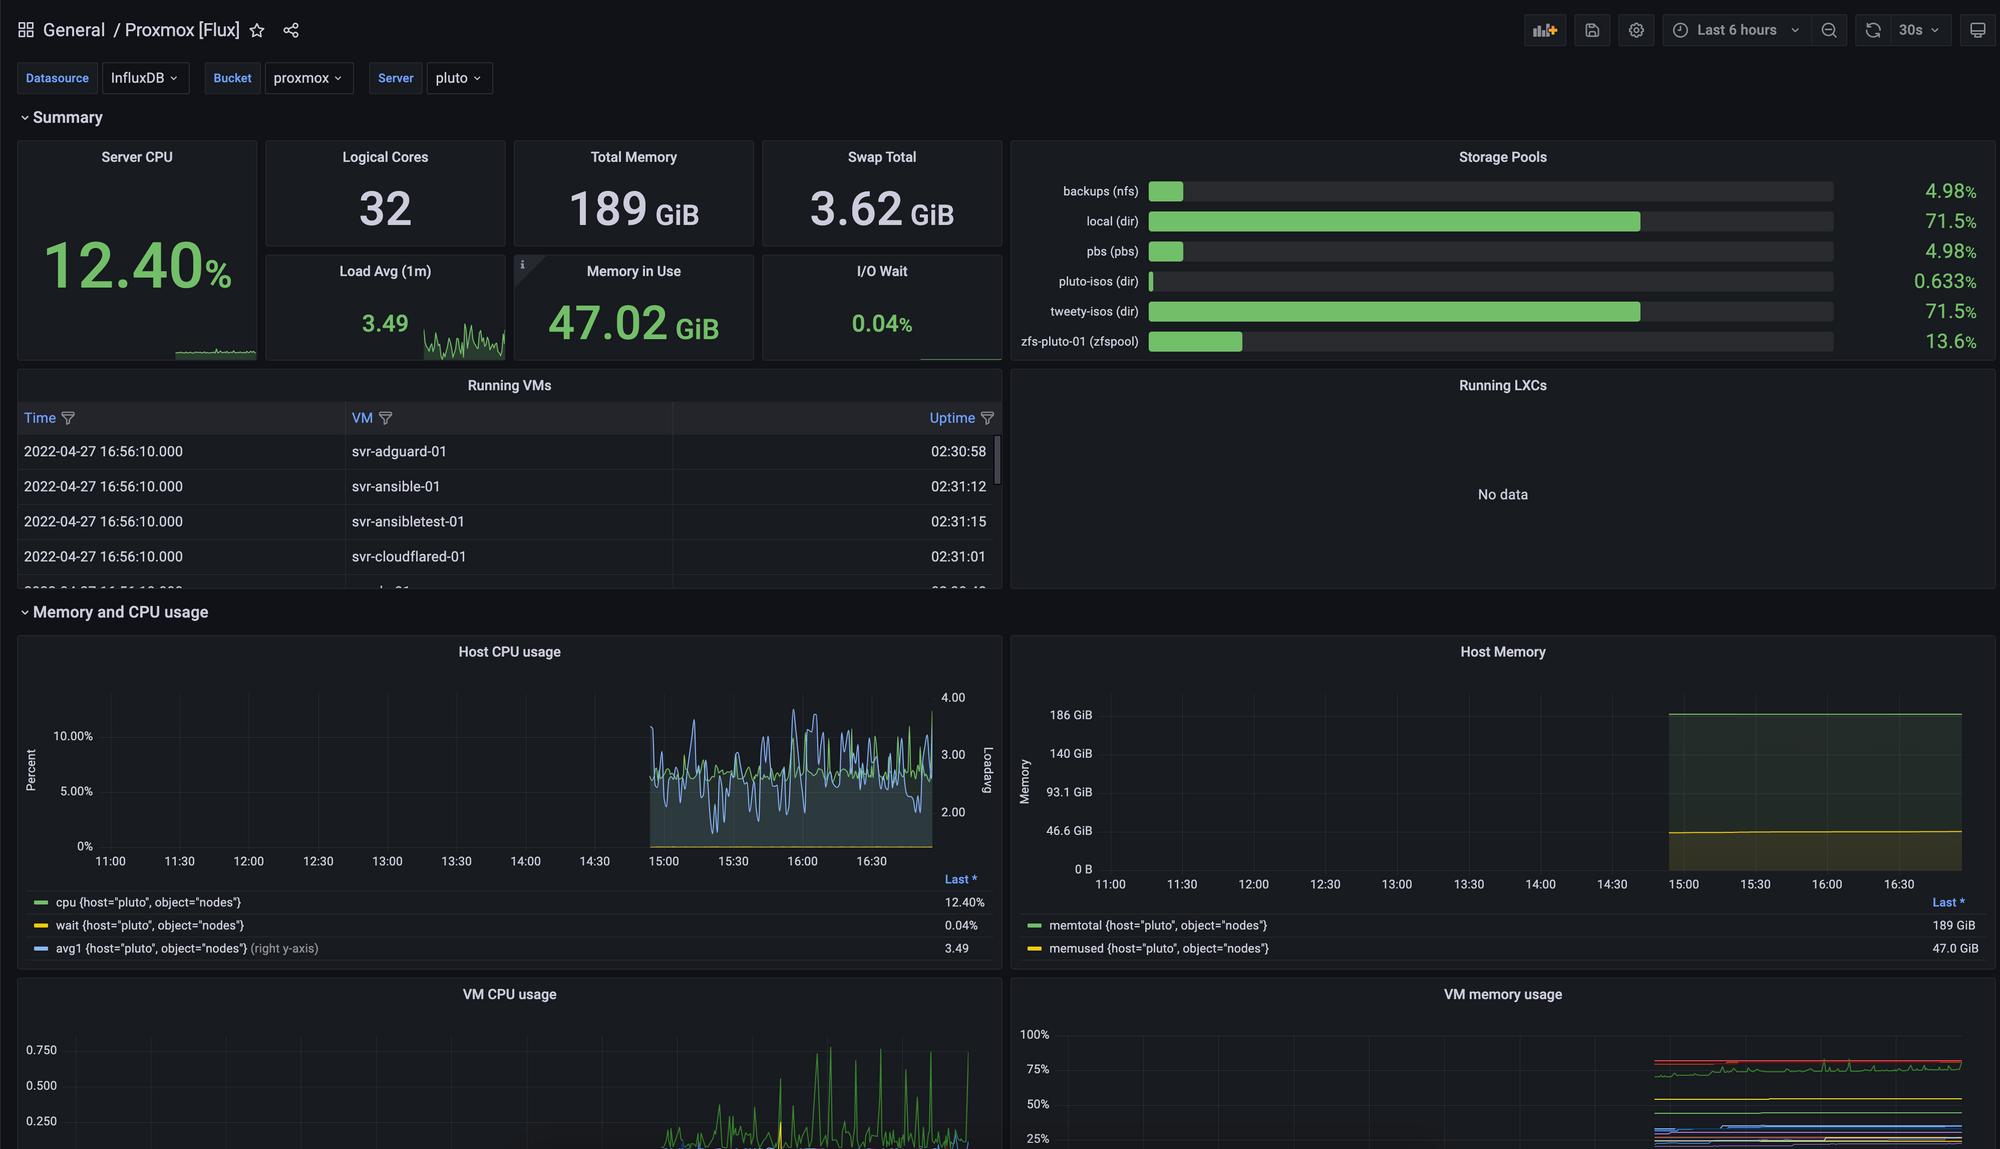
With that, you should now have a working Grafana dashboard! This has definitely been one of the more exciting projects I have completed. I have always wanted to get Grafana up and running but up until now, haven't gotten around to it.
I have found that there are countless useful metrics provided by the dashboard and am excited to explore other dashboards in the future
I hope you found this guide helpful. If you did, consider adding my site to your RSS reader using the following URL: